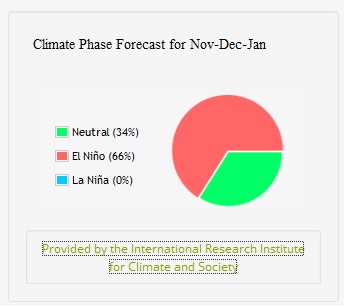
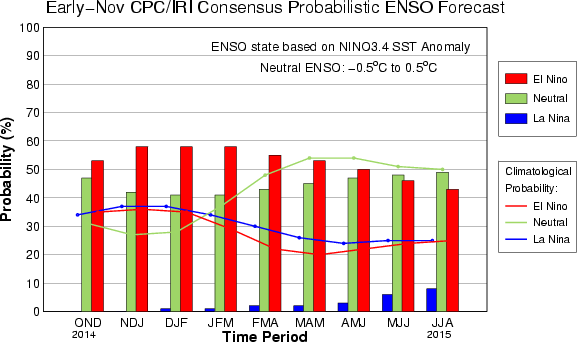
One of the toughest things for climatologists to explain is what a 55 percent chance of El Nino or a 40 percent chance of an above normal winter is. Two examples of probabilistic forecasts are shown below. The pie chart is from AgroClimate.org and the bar graph is from IRI at Columbia University. Most people think they are just wishy-washy and that climatologists are just hedging their bets. Well, NOAA just put out an excellent blog posting describing how to make sense of these probabilistic forecasts, which are so common in climate outlooks. You can read it at https://www.climate.gov/news-features/blogs/enso/betting-climate-predictions.