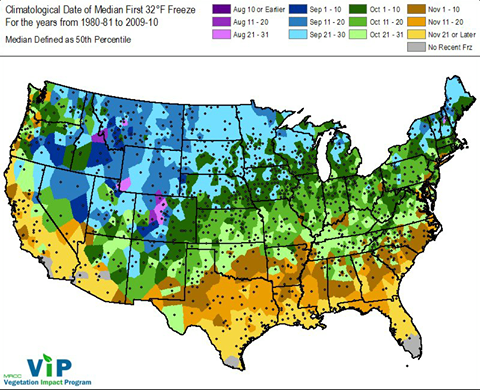
Now that fall has finally arrived, it’s time to start thinking about when frost will return to the Southeast. Here are a few resources to help you find the average date of first fall frost. I will post an article later this week that describes how to get real-time frost forecasts. Keep in mind that local variability of frost dates depends on elevation, slope, tree cover, soil type, and a number of different variables, so these should be used as general guidelines–you know your own land better than anyone!
AgroClimate.org has maps which show the 10%, 50% and 90% dates of first fall frost at https://agroclimate.org/tools/freeze-risk-probabilities/. These maps show the average date range in which one out of ten years will have experienced the first fall frost, five out of ten (or median date) and the range of dates for which nine out of ten years will have experienced a 32 F frost. Since these are based on county data, you will not be able to drill down to your specific location.
Georgiaweather.net provides lists of first frosts for the period of record of the individual stations. On the main web site, pick your station and then go to the left menu and pick Seasonal and then First Frost to get the list. Again, this is representative for just that station so areas with a different topography or soil type could see some differences.
The Southeast Regional Climate Center provides graphs and tables of frost probabilities from their web site at https://www.sercc.com. On the top menu choose Climate Data, then Historical Climate Summaries (I like the old version better), then click on the text link to the state above the map and click on your station. On the left side of the page you will see Fall Freeze Probabilities about halfway down, and that will give you a graph showing average dates of last freezes for different temperature thresholds.
If you want maps, the Midwestern Regional Climate Center’s Vegetation Impact Program has a nice website which lists not only climatological freeze dates for 32 F and 28 F but also shows this season so you can trace the movement of the frost line south over time. You can view the site at https://mrcc.isws.illinois.edu/VIP/frz_maps/freeze_maps.html.