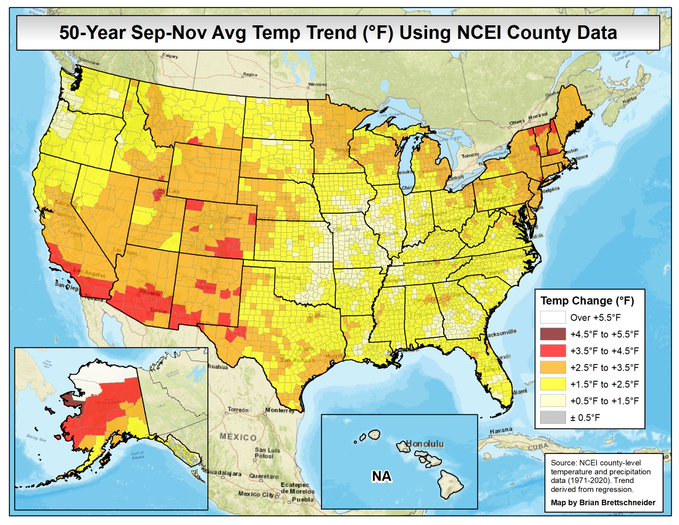
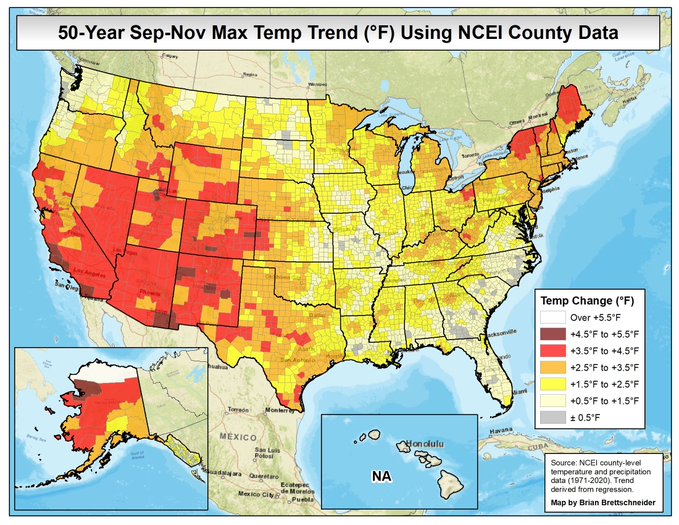
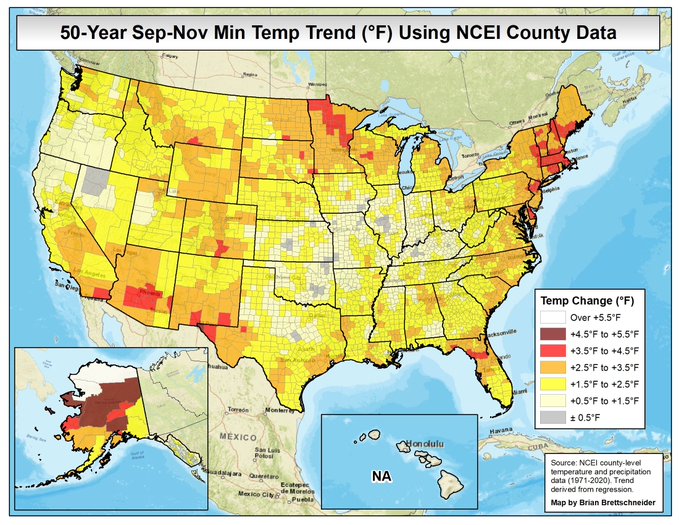
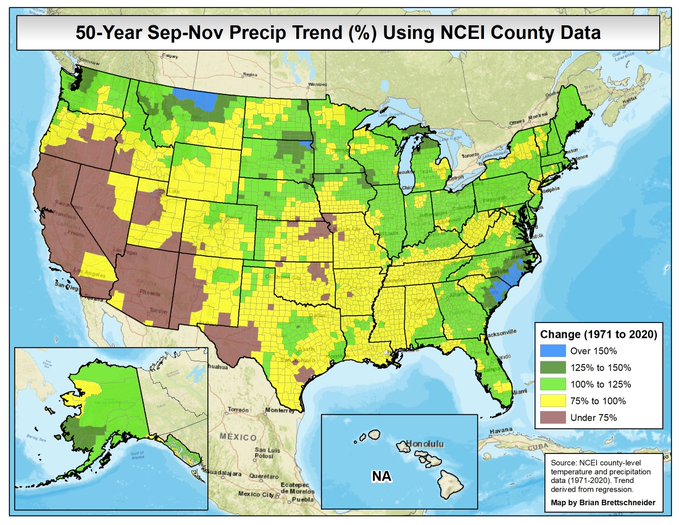
My favorite Twitter climatologist, Brian Brettschneider @Climatologist49, produced this series of maps for fall showing the trends over the last 50 years, just a few years shorter than the average age of a farmer in the US. The maps show that for fall, there is only one county in the US (in SE Iowa) that has not had a temperature increase of at least 0.5 F. Most places in the Southeast have experienced at least 1.5 F increase. Maximum temperatures have generally not increased except around big cities like Atlanta and Birmingham, so most of the warming is coming from much warmer minimum (early morning) temperatures. Fall precipitation has increased in most places except Alabama, and has increased the most in the coastal Carolinas. This may be showing the effects of recent hurricanes like Matthew and Florence, since large values near the end of a time can have a strong influence on the calculation of a trend.