The evaporative stress index is a way of measuring rates of evapotranspiration from plants and the ground using satellite data. The higher the rates of water use, the more negative the evaporative stress index. The two maps below show the maps for September 2 and September 8.
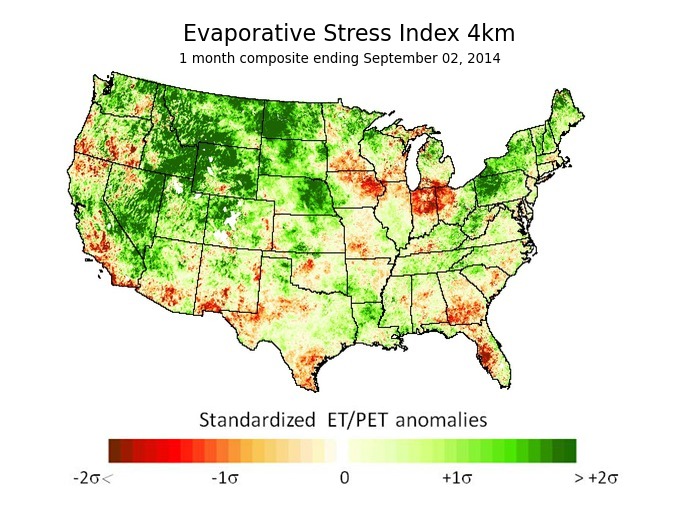
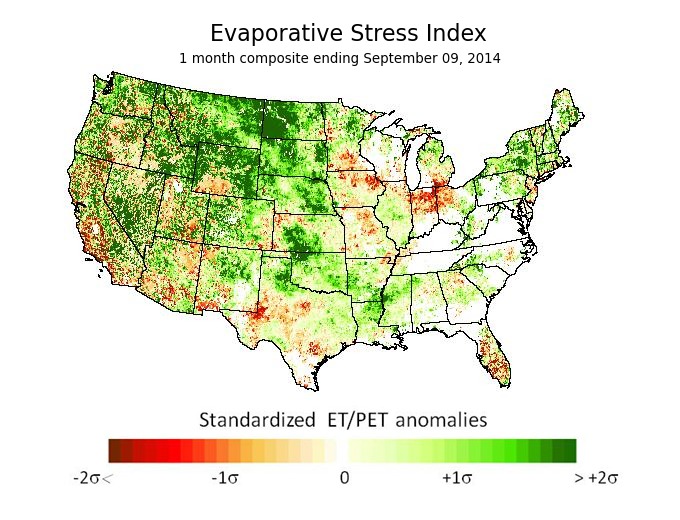
You can see that on September 2, the anomalies in south Georgia were quite negative. This corresponded with a period in which severe drought expanded across that region. By comparison, in the following week the anomalies were near zero and drought was not expected to further expand in this area as more rain showers moved through. In the future, this index is expected to help identify areas that are likely to develop flash droughts, which are rapidly developing severe droughts which occur mainly during summer due to high temperatures coupled with persistent dry spells.
You can access the latest evaporative stress index image at www.drought.gov (direct link here). A short article from USDA is located here. An article on how it might assist in drought detection in Oklahoma from NewsOK is available here.