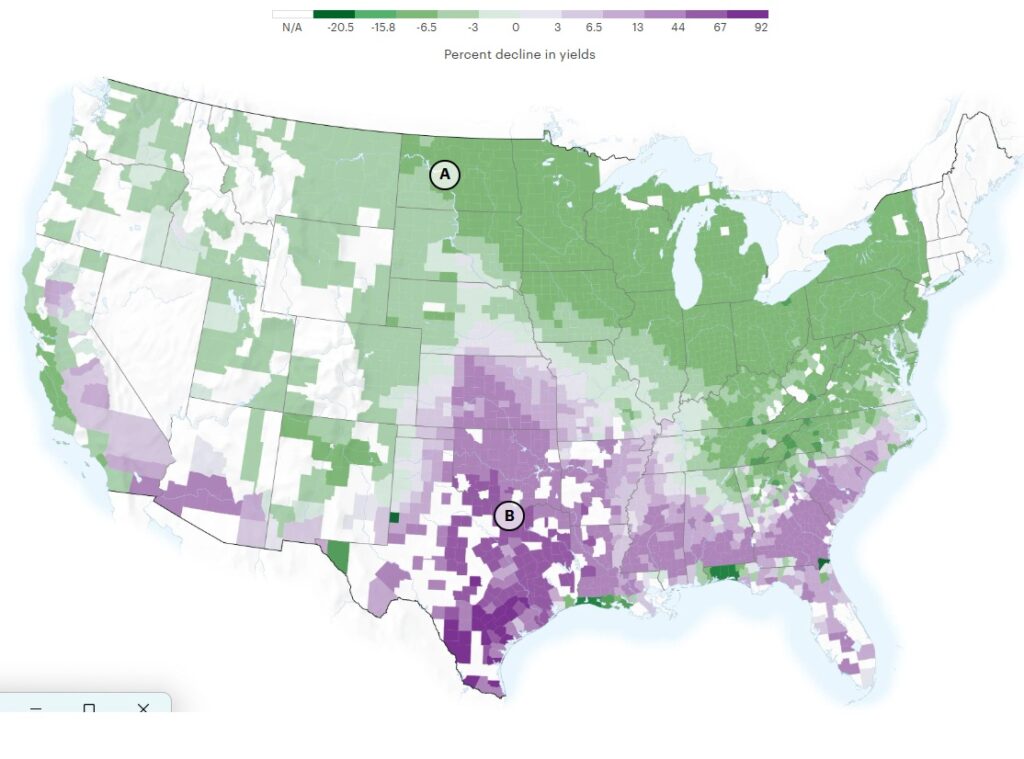
ProPublica published a series of maps describing how the climate of the US is likely to change by mid-century back in 2020. It popped up in my social media feeds this week so I thought it might be good to highlight it again. You can see the article at https://projects.propublica.org/climate-migration/. One of the most striking maps from an agricultural standpoint is the map below, which shows projected changes in yield for commodity crops across the country. This is for a moderate increase in emissions, which is very likely to occur, rather than the high emissions levels used by some of their maps (or they give you a choice). Areas in purple are expected to see significant decreases in yield by the 2040-2060 period based on the increased temperatures and humidity as well as increases in evaporation and reduction in available water. This area includes most of the coastal plain across the region where the biggest crop yield from commodity crops now occurs. The only places that are likely to see an increase in yield are higher elevations and more northerly locations, which will see warmer temperatures that lead to a longer growing season.
Of course, this is only based on climate and there will be other factors at play as well, such as what is happening in other countries that could affect market pricing of the crops as well as the inputs like fuel and fertilizer. Still, it highlights the stress that it will be putting on our farmers in the not-that-distant future when they are already under tremendous attack from poor pricing, high input costs, difficulty getting field workers, etc. Not to mention extreme weather events like hurricanes and late freezes.
