Today is the start of astronomical summer, when the sun is highest in the sky. You can read more about the solstice at https://www.space.com/summer-solstice-when-what.
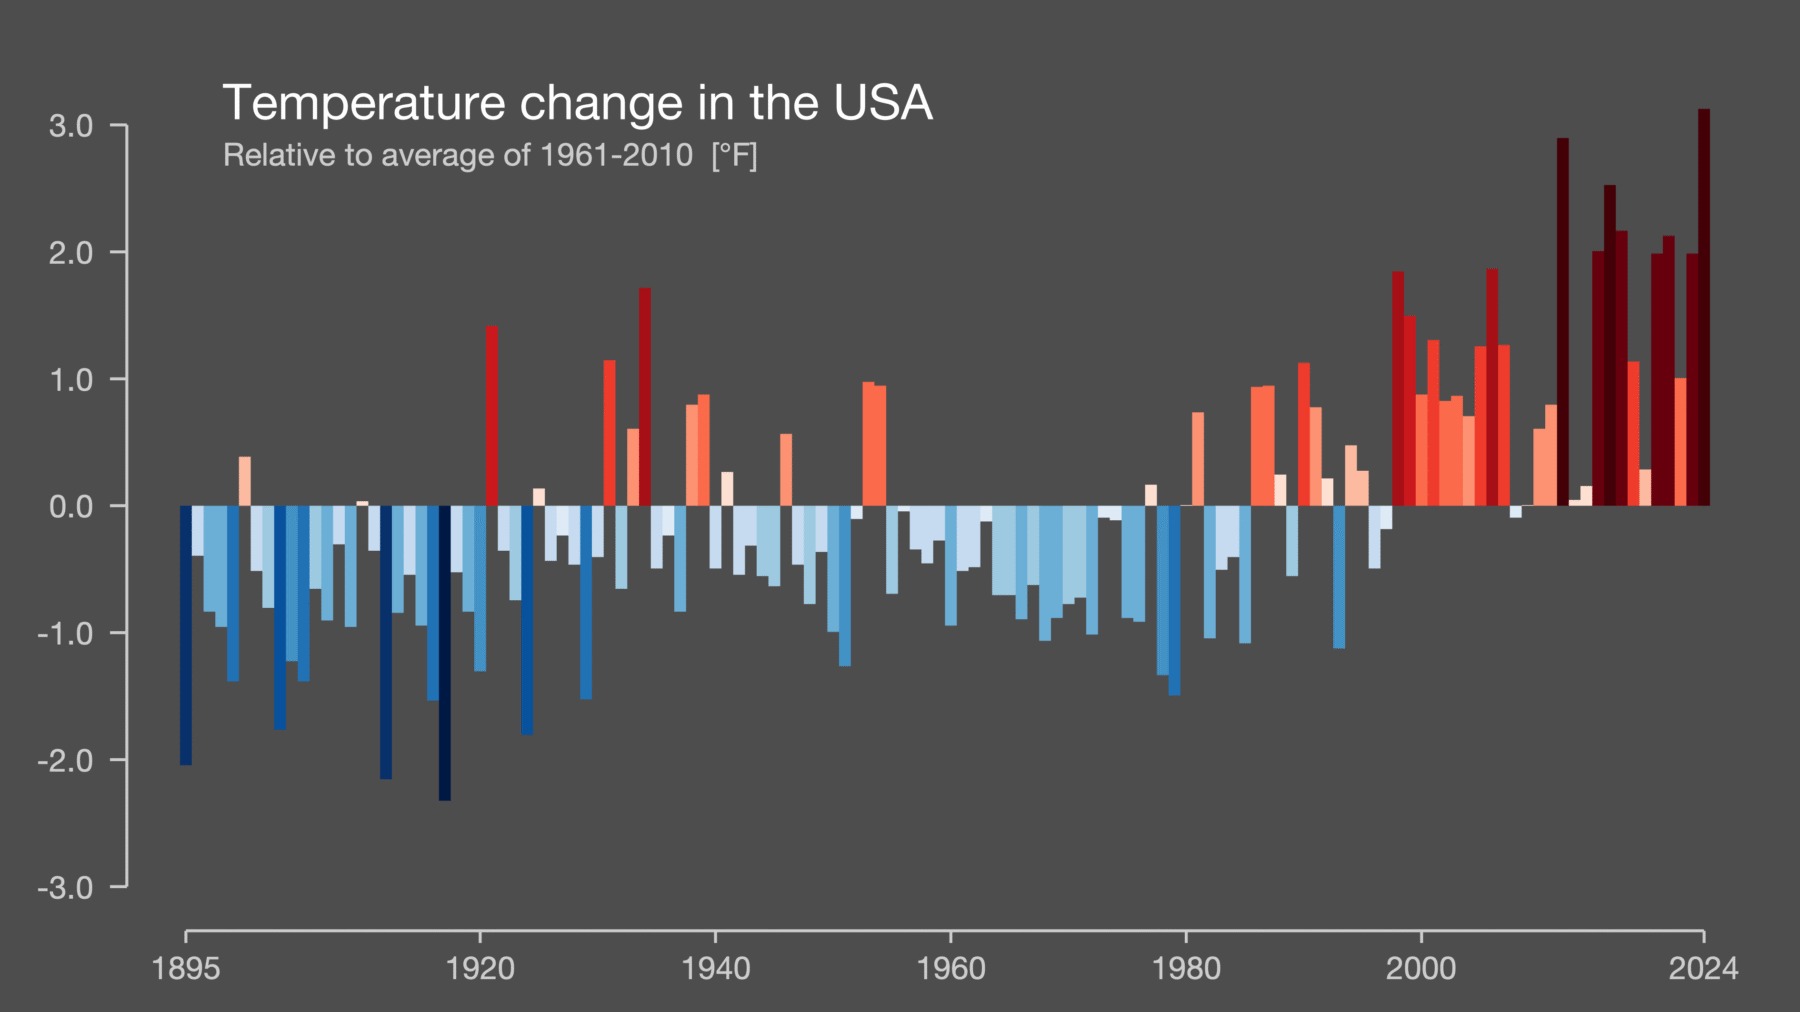
Today is also Share Your Stripe Day, when people across the world share their stripes that depict the earth’s warming climate. The graph below shows the annual average temperature for the United States from 1895 to the present compared to the average from 1961-2010. You can see how much the temperature has warmed over time. It is well-established by science that most of the warming is caused by the build-up of greenhouse gases in the atmosphere and scientists expect this trend to continue for the foreseeable future because we have only started to curtail how much greenhouse gases, especially carbon dioxide and methane, are released into the atmosphere. They trap heat near the surface of the earth, leading to increases in surface temperature that are documented throughout the world but are especially large in Arctic areas due to the loss of sea ice and snowcover. Cities add additional heat through lack of trees and extra pavement but most of the warming is observed in rural locations as well, so it is not just related to urban heat. If you are interested in looking at the stripes for a different location, check out https://showyourstripes.info/c/globe and pick out a different location.