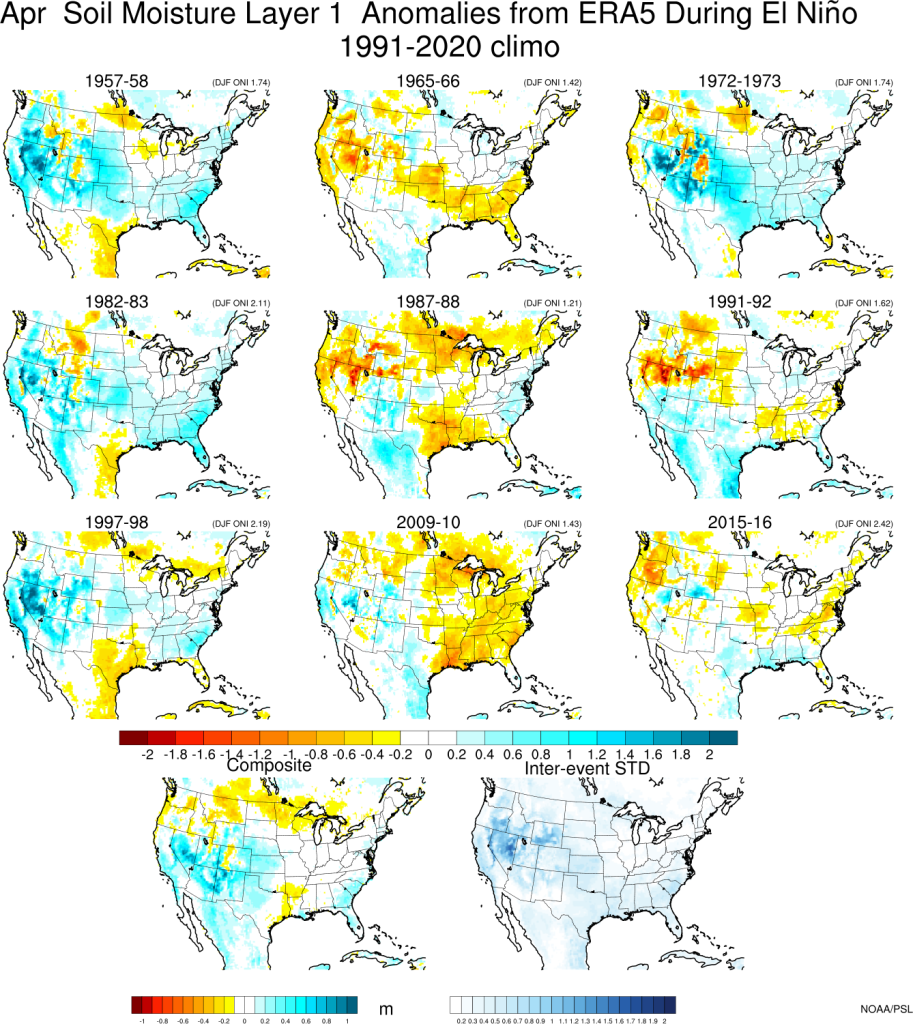
If you like to play with maps and climate outlooks, you might be interested in this NOAA site from their Physical Sciences lab. It allows you to look at the individual climate anomalies for each EL Nino or La Nina in the period 1991-2020 to see how they varied. It shows both global patterns and US patterns, with some additional information that I have not often seen in climate maps.
For example, the set of maps shows that soil moisture in April, when many producers are thinking of planting, in five out of ten El Nino events, the soil moisture was wetter than normal in Georgia (what you would expect after a wet winter), but two years were drier than normal and three years were near normal. So even though you might expect the soil to be wet in spring, that is not always the case. Climate predictions are based primarily on statistical patterns of temperature and precipitation in past El Nino and La Nina events, but since every event is unique, the statistically most likely pattern does not always occur. Try it out at https://psl.noaa.gov/enso/difference/?fbclid=IwAR0L_PqJiX8VOmShDyxfMglxRJpCVDpCPGzWJDhaV9hQ96ppVXC60ivRncE.
