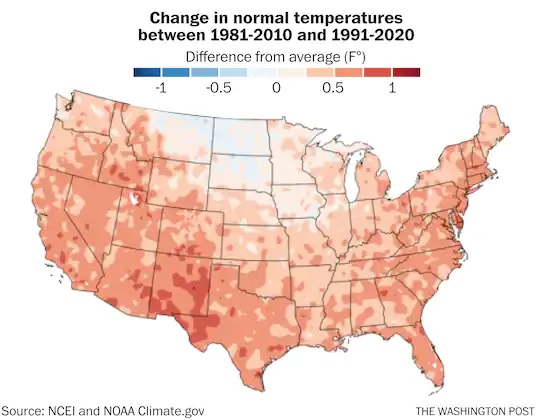
You have probably read here or elsewhere that NOAA just updated the normals for climate data across the US. They went from the 1981-2010 averaging period to the 1991-2020 averaging period. The results for most of the country were that the new normal temperature was higher than the old ones, and precipitation also went up for many parts of the US. You might be interested in seeing how they changed for the National Weather Service coop station nearest to you. Here are two links that will allow you to determine the old and new normals for many stations across the US. I am not sure how long the 1981-2010 link will go to that averaging period, so let me know if it does not work any more. You can compare monthly, annual, and daily normals for many of the stations. Keep in mind that some stations only report precipitation and not temperature, and some stations were not around in the 1980s so normals were not calculated during the earlier period.
1991-2020 normals look-up
https://www.ncei.noaa.gov/access/us-climate-normals/
1981-2010 normals look-up
https://www.ncdc.noaa.gov/cdo-web/datatools/normals