The content on this page is retained only for recordkeeping, historical reference, or research. These materials are preserved in their original form and may not meet current WCAG 2.1 AA accessibility standards.
These archived materials are not required to be remediated. However, we remain committed to equitable access. If you need an accessible version of any archived item to participate in our current programs and services, we will provide one when feasible upon request at caesweb@uga.edu.
Here is a cute 6-minute video which explains how drought is assessed in the US by the Drought Monitor. It’s produced by our CoCoRaHS friends, who also have a lot of handy videos on how to measure precipitation. It includes a discussion of what the different drought classifications mean and how the Drought Monitor is made. You can view it here.
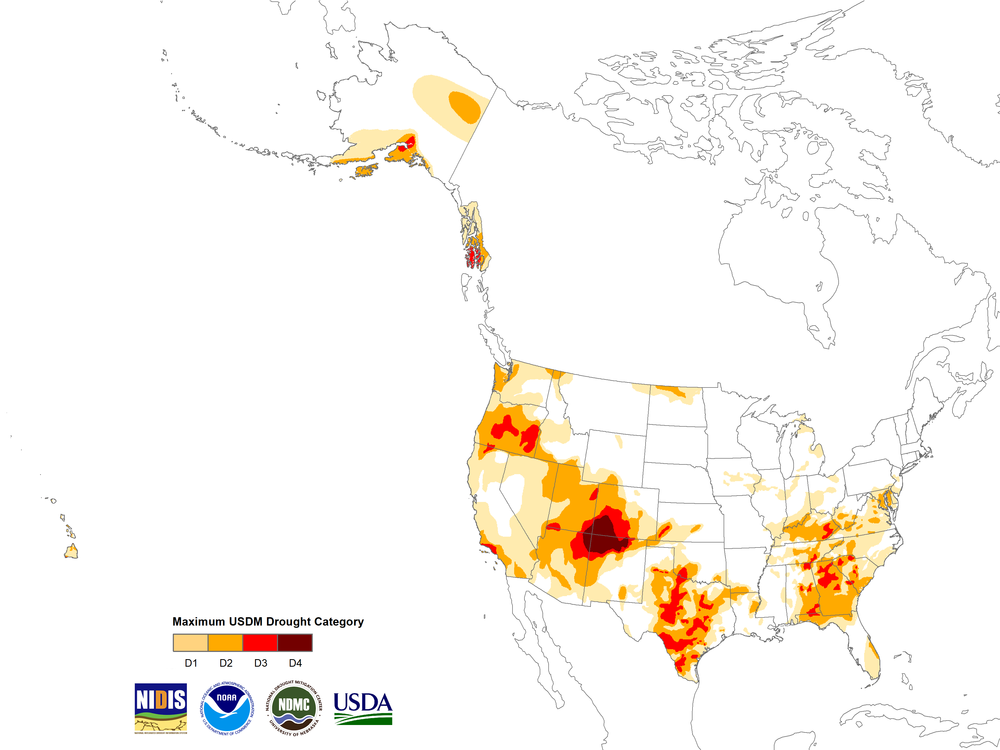
Map displays the maximum weekly U.S. Drought Monitor category reached during 2019