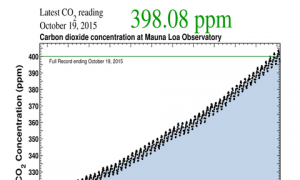
Here is a new animated graphic which shows how the global carbon dioxide level is changing at the same time that emissions and volcanism are changing. As you watch the time change, you can see the CO2 level creep up, especially in response to emissions. The impacts of El Niño and La Niña are also shown. You can see it at https://folk.uio.no/roberan/t/CO2_drivers.shtml.
