A massive new report published by the federal government on Friday looks at causes of warming climate and concludes that it is mainly caused by humans rather than due to natural causes like solar variability. As you can imagine, there have been a number of stories published in the news describing these results. Here are some of the news stories, most of which also have links to the original published report. Note that if you live in the southeastern US, temperature rises here have been much less than in other parts of the US and the world due to a combination of natural forces like oceanic variability and human-caused changes like reforestation and pollution, but the Southeast has also been warming at a rapid rate since the 1960s.
Associated Press: US report contracts Trump team: Warming mostly man-made
USA Today: Humans to blame for global warming, massive federal government report says
Weather Underground: Blockbuster Assessment: Humans Likely Responsible for Virtually All Global Warming Since 1950s
Washington Post: A photographer selects images that visualize the impact of climate change
Washington Post: Trump administration releases report finding ‘no convincing alternate explanation’ for climate change
You can download the report and read it for yourself at https://science2017.globalchange.gov/downloads/.
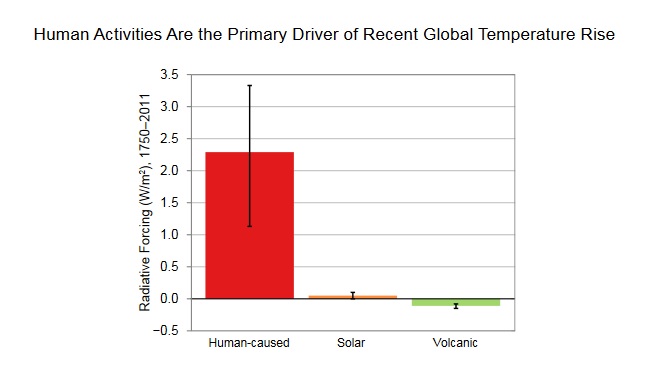
Global annual average radiative forcing
change from 1750 to 2011 due to human activities, changes in total solar
irradiance, and volcanic emissions. Black bars indicate the uncertainty in each. Radiative forcing is a measure of the influence
a factor (such as greenhouse gas emissions) has in changing the global balance of incoming and outgoing energy. Radiative
forcings greater than zero (positive forcings) produce climate warming; forcings less than zero (negative forcings) produce
climate cooling.
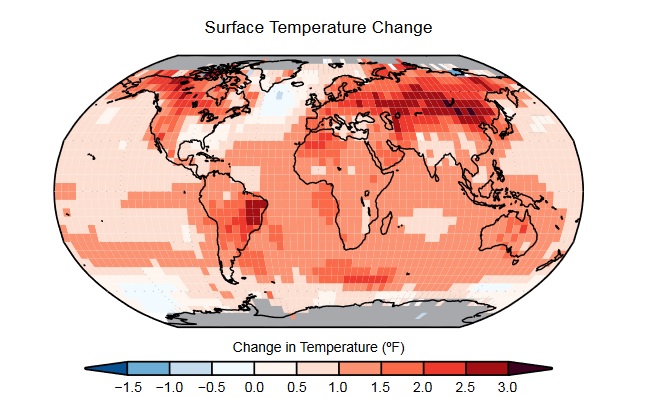
Surface temperature change (in °F) for the period 1986–2015 relative to 1901–1960 from the NOAA
National Centers for Environmental Information’s (NCEI) surface temperature product. For visual clarity, statistical sig
–
nificance is not depicted on this map.
Changes are generally significant (at the 90% level) over most land and ocean
areas.
Changes are not significant in parts of the North Atlantic Ocean, the South Pacific Ocean, and the southeastern
United States.