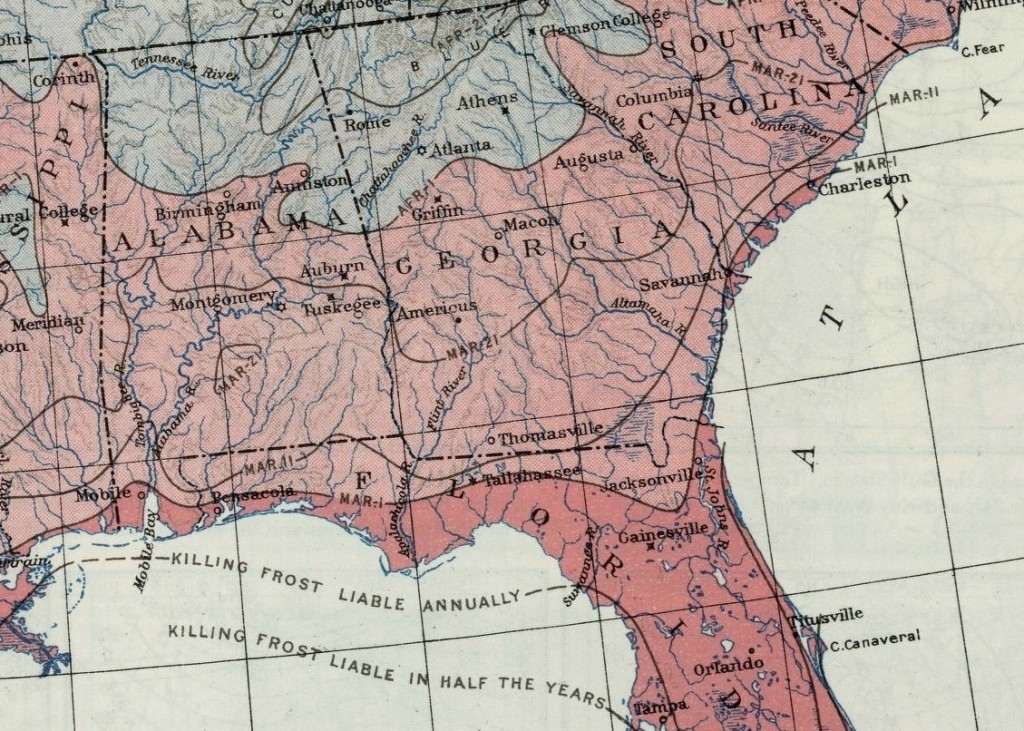
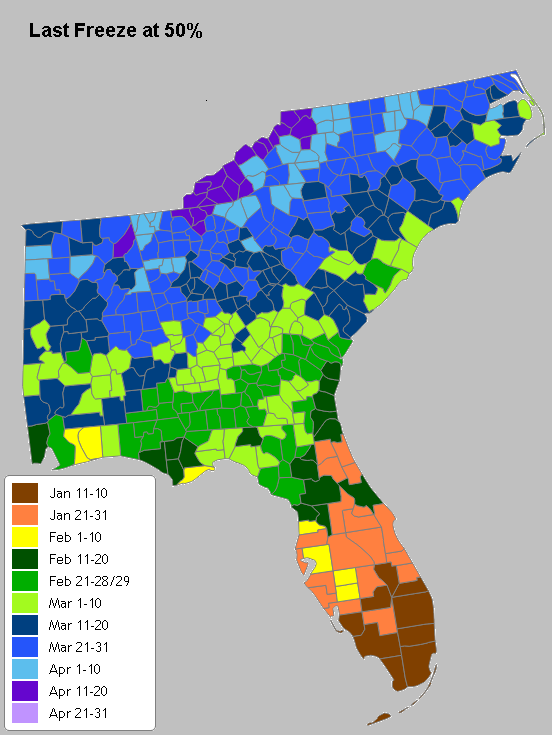
Slate magazine published some historical frost maps from 1916 which show the spring and fall frost dates for the US based on the historical climate record from early in the century. You can see the article and copies of the maps at https://www.slate.com/blogs/the_vault/2016/03/28/history_of_climate_change_as_seen_in_frost_maps_from_1916.html. I’ve put a zoomed in version of the spring frost map below. Next to it I’ve put a modern frost map from Agroclimate.
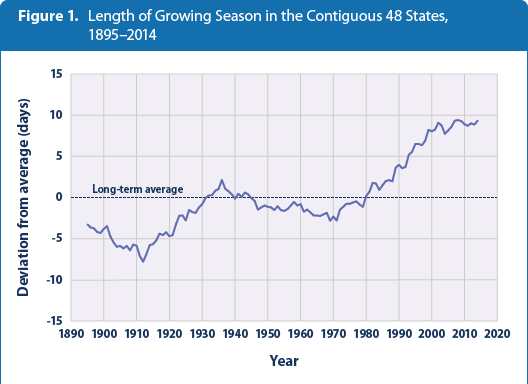
If you compare the two, you can see that the average last frost date in spring for Thomasville GA in southwest Georgia, for example, changed from around March 13 to February 22. The growing season has also expanded in fall, leading to an overall increase in the length of the growing season that EPA described in https://www3.epa.gov/climatechange/science/indicators/health-society/growing-season.html. Their graph for the lower 48 states is shown below.
The increased length of the growing season is attributed to the upward trend in temperature over time. The longer growing season has allowed farmers to choose different crops that take longer to reach maturity and has also allowed more double-cropping to be used. But it also provides a longer time period for pests and diseases to develop and affect those crops.