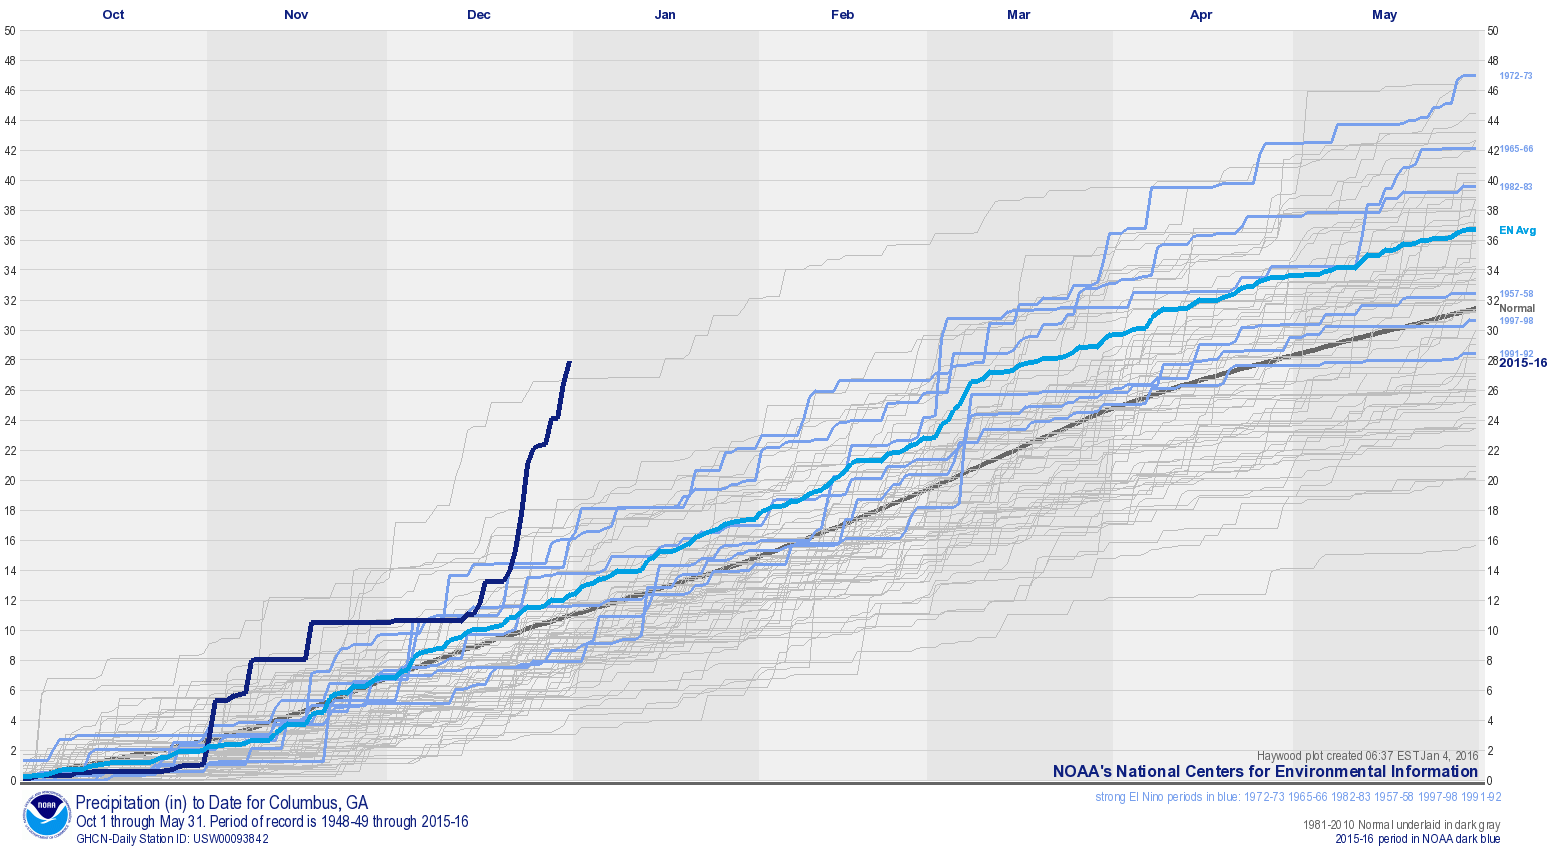
The National Centers for Environmental Information (NCEI) has a page which allows you to graph accumulated precipitation for selected stations across the country and compare this year to previous years. These graphs are called Haywood plots and you can view the current graphs at https://www.ncdc.noaa.gov/monitoring-references/dyk/elnino-2015-2016 under “Haywood Plots”. Previous strong El Niños are highlighted in blue with other years in pale gray.
When I looked at these, I noticed that this year’s curve for Columbus GA is above every other curve for the station, meaning that the water year to date is the record highest. A water year is a hydrologic term for an annual period starting on October 1. You can check your own area to see how this year compared to previous water years. Not surprisingly, several stations in North and South Carolina are also at their record wettest water year to date after the record flooding right at the beginning of October.