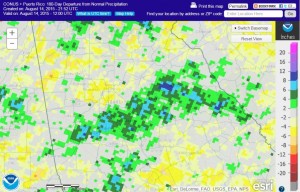
I noticed today that the National Weather Service has updated their radar-based maps of estimated precipitation for the US. Previously the maps were static and you could only look at a few prescribed regions, but now they have a new zoomable version which can cover the entire lower 48 states or a fraction of a state. You can adjust the transparency of the background maps to show as much or as little detail as you want. This is a nice addition to the variety of sources of graphical weather data that are available for you to look at, particularly in areas that are not well covered by traditional rain gauges.
The maps below both show the 180 day precip departure from normal maps. You can see the region of very wet conditions in the central US as well as the extremely dry conditions on the West Coast. The zoomed in map shows the area of very wet conditions in the Athens GA area where I work compared to the much drier conditions in Atlanta and Macon, which missed a lot of the storms. The actual maps on the computer show better detail than I can provide in these screen captures, and higher resolution maps are also available.
The interactive map is available at https://water.weather.gov/precip/#. Give it a try!

