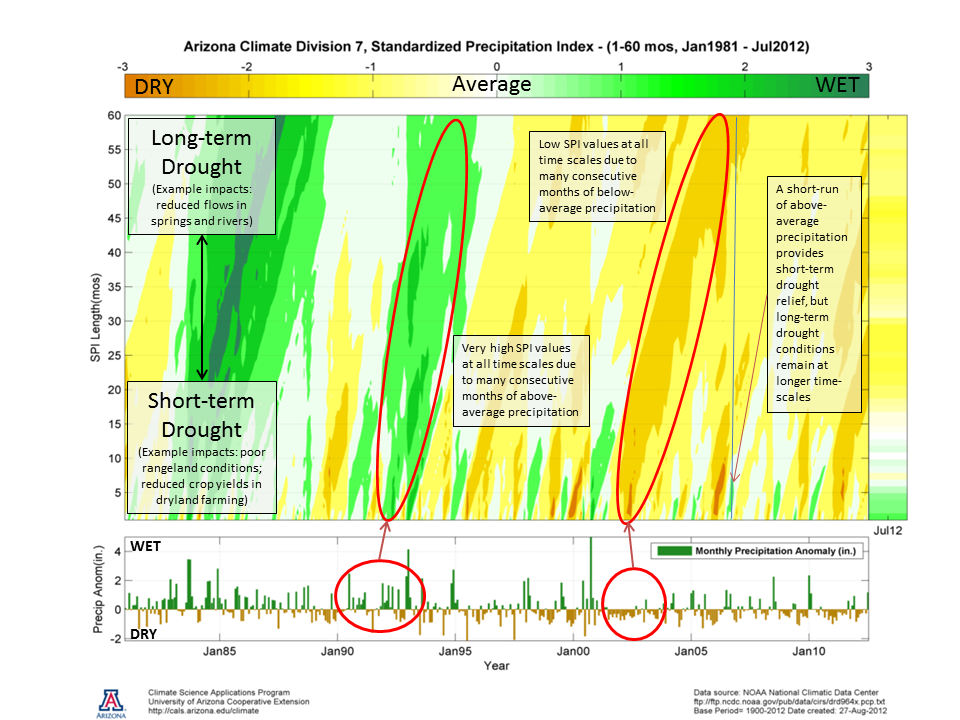
A new tool from the University of Arizona Climate Science Applications Program displays standardized precipitation index (SPI)values for a range of time scales over time. SPI is a calculated rainfall amount that takes into account the average rainfall and the standard deviation of rainfall over time and puts it in a standard format which can be easily compared between regions with different average precipitation conditions. On the graph, green indicates a precipitation surplus and yellow indicates a precipitation deficit. The higher up on the graph, the longer the time scale of the SPI value. Time moves from 1985 on the left to the present on the right.
The description of this tool is located here and an example of how to read the plot is below for AZ.
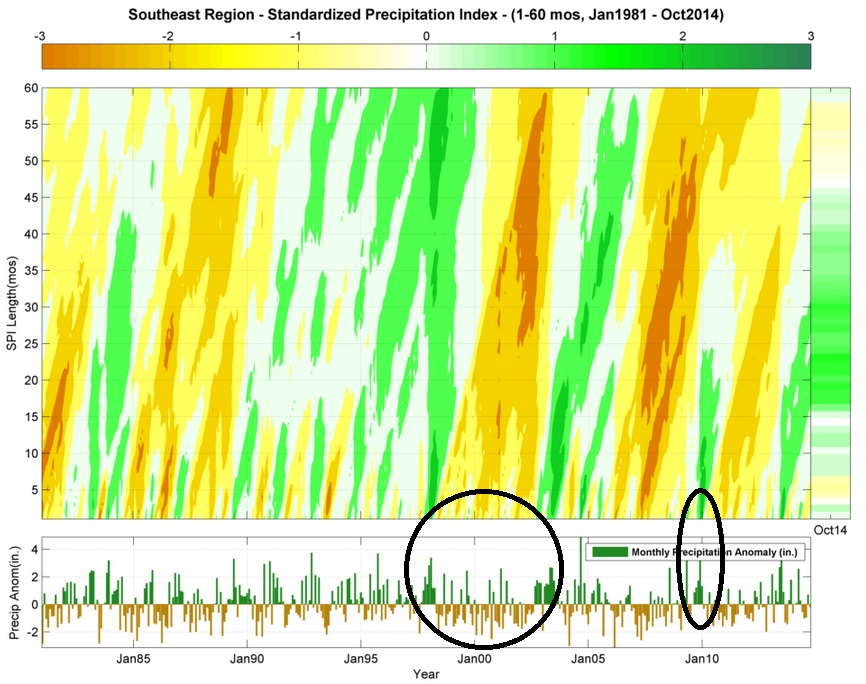
For the Southeast, the graph shows that recent years at many time scales have been dominated by dry conditions (not a big surprise considering that we have had three major droughts in the last 15 years). The 1998-2002 drought had the lowest SPI values at longer time scales (large black circle) while the 2007-2009 drought had its lowest SPI values at more intermediate time scales, indicating a drought that came on faster but moderated more quickly. The wet spell in late fall 2009 (thin black oval) was very short and did not really affect the longer-term dry conditions at all.
You can get similar charts for individual states at https://cals.arizona.edu/climate/misc/spi/spi_contour_states.html