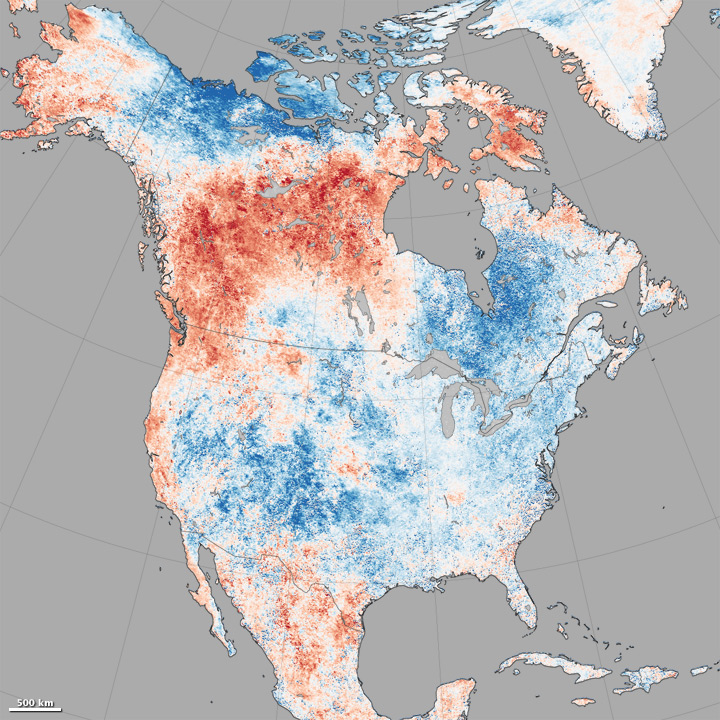
This map of satellite-based temperature anomalies from July 27 to August 3 shows the strong temperature gradients that have occurred across North America due to the large ridge of high pressure on the west coast of the US and the deep trough of low pressure in the east. Areas in blue are unusually cold and areas in red are unusually warm. This large pattern has led to an unusually pleasant summer across much of the Southeast. The pattern is locked by a large area of warm water in the Gulf of Alaska which is keeping the western ridge in place. This pattern could continue into the fall, according to some recent forecasts from commercial forecasting firms.