In addition to the data access site cli-MATE from the Midwestern Regional Climate Center, there is another web site which provides access to the National Weather Service’s cooperative weather observing network. It’s called xmACIS and contains a lot of the same information as the cli-MATE site (in fact, it’s built on the same datasets). You can access it at https://xmacis.rcc-acis.org/. Unlike cli-MATE, it does not require a log-in.
xmACIS has data for all over the country, but it’s a bit tricky to use. First, pick “Single Station” “Graphs” “Accumulation.” Then you need to set a time frame under options. Finally, you will choose a location. To do so, first pick your local NWS office, then choose your city. If you don’t know your NWS office, go to https://www.weather.gov and click on the map at your location and it will bring you to the correct location.
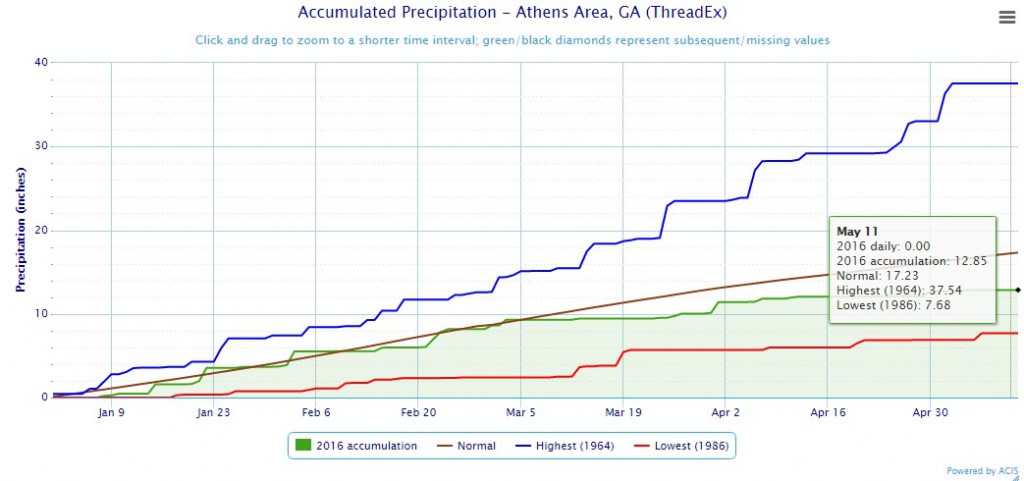
An example of the kinds of information you can get from xmACIS is below. The precip accumulation graph shows this year’s precipitation accumulation compared to the record low and high and the average. For Athens, we are running below normal for the year to date, but not at record low levels.