One of the frustrations of trying to keep track of rainfall across your county is the scarcity of rain gauges you may have access to. There are a number of networks that collect rainfall information, including the NWS coop network, the UGA automated monitoring network (or FAWN in Florida, or one of the other university networks in other Southeastern states), the Georgia Forestry Commission weather network, and the CoCoRaHS network, but in the more rural counties there may be only one or two official stations in the entire county (if that). An alternative that allows you to look at rainfall patterns across the area is to use radar-estimated rainfall from the National Weather Service. You can get it at https://water.weather.gov/precip/. It’s a zoomable map that allows you to pick daily, weekly, and longer time frame images of rainfall which can display in numerical totals or in departures from normal. It also allows you to overlay county lines or other geographical boundaries. I usually just do a screen capture if I want to show it in a presentation, but I think there are downloads available as well.
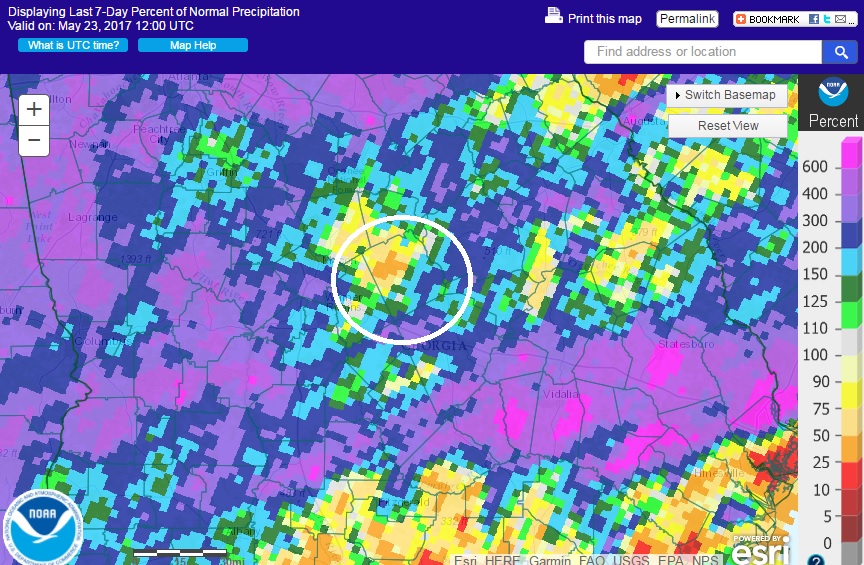
For an example, here is today’s 7-day rainfall percent of normal for the Southeast and then a zoomed-in version with Wilkinson County GA circled in white. You can see the big variation in rainfall across this one county quite well in the radar estimated rainfall, but if you only had one or two gauges you would miss a lot of the detail here. A new map is created each morning for the preceding 24 hours. The raw radar values are calibrated by actual rain gauges, which gives us a fair degree of confidence, although since it is an estimate based on radar (which is above the surface) it is not going to be perfect. But you might find it useful in looking for variations across your county or other area of interest.
In this week’s map, you can see the purple bands of heavy rain that covered much of northern Georgia and the relative lack of rainfall in southeastern Georgia (red and yellow), which is contributing to the continuation of the drought there. Hopefully after the next couple of days that region will start to see some improvement as more rain moves through the area.