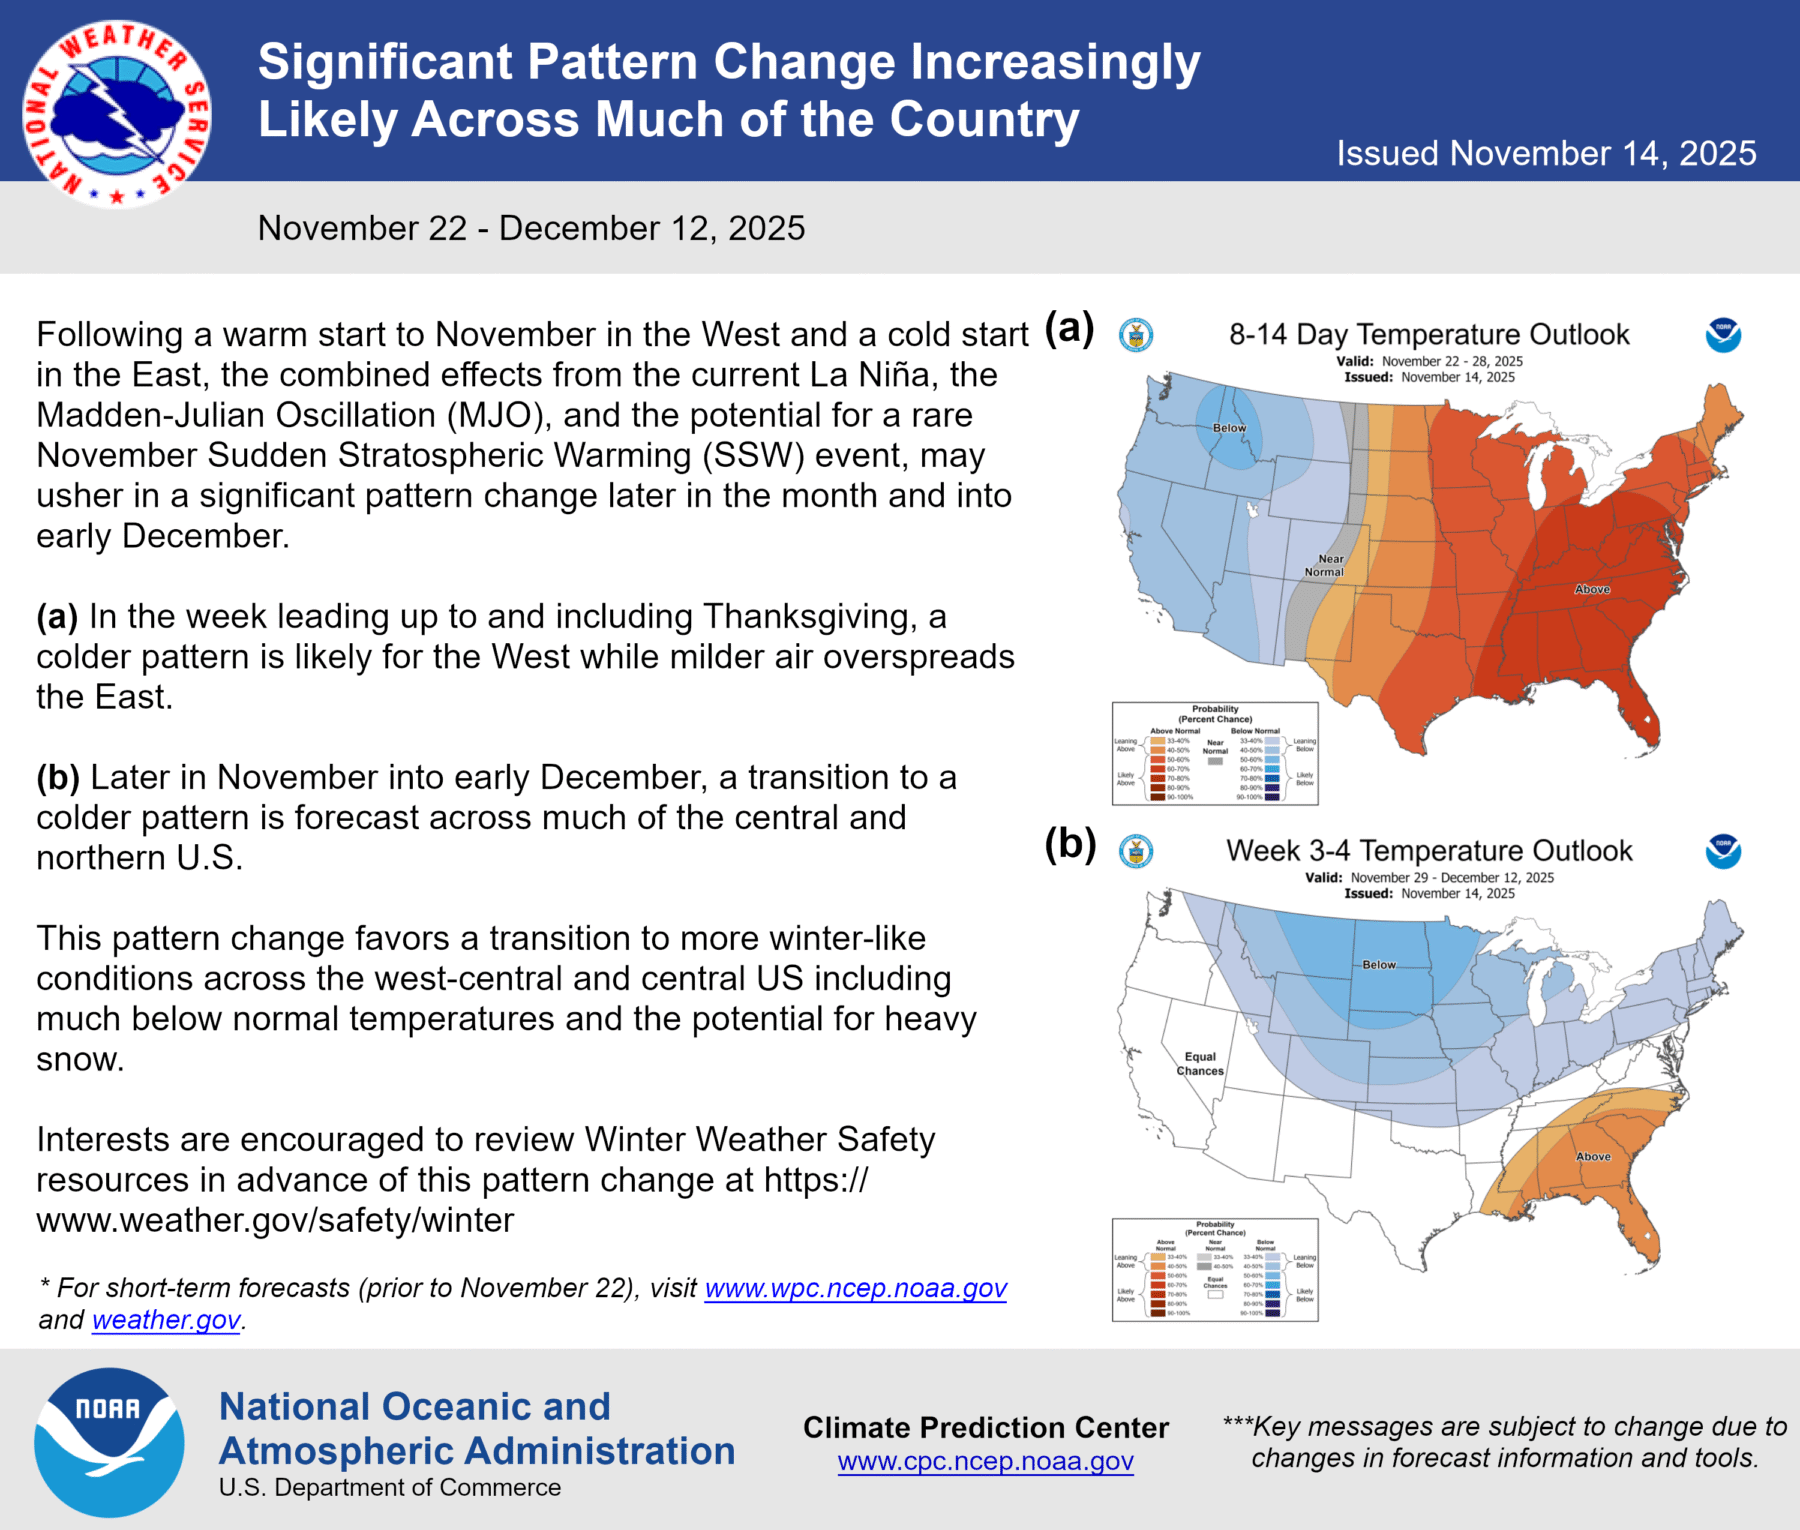
NOAA’s Climate Prediction Center posted an infographic earlier this week describing what they think will be a significant pattern shift late in November through mid-December. The current pattern is showing warm air in the eastern US and colder air in the western US, but after the shift occurs the coldest air will shift to the northern states with the warmest conditions likely in the Southeast, with most of the areas between these two regions listed as Equal Chances of below, near, or above normal conditions. You can see the infographic below.