NOAA has released its global climate summary for January 2015 today. You can read the full analysis at https://www.ncdc.noaa.gov/sotc/global/2015/1. The latest summary shows that for the Earth as a whole, the average temperature was the second warmest since records began in 1880. However, the distribution of temperatures was varied as usual. The map below shows the global anomalies from the long-term average and indicates that the eastern US was one of the few areas that was colder than average. The record-setting warm ocean temperatures along the West Coast and east of the US may have helped set up the high-amplitude wave pattern which has brought cold air to most of the eastern US this year.
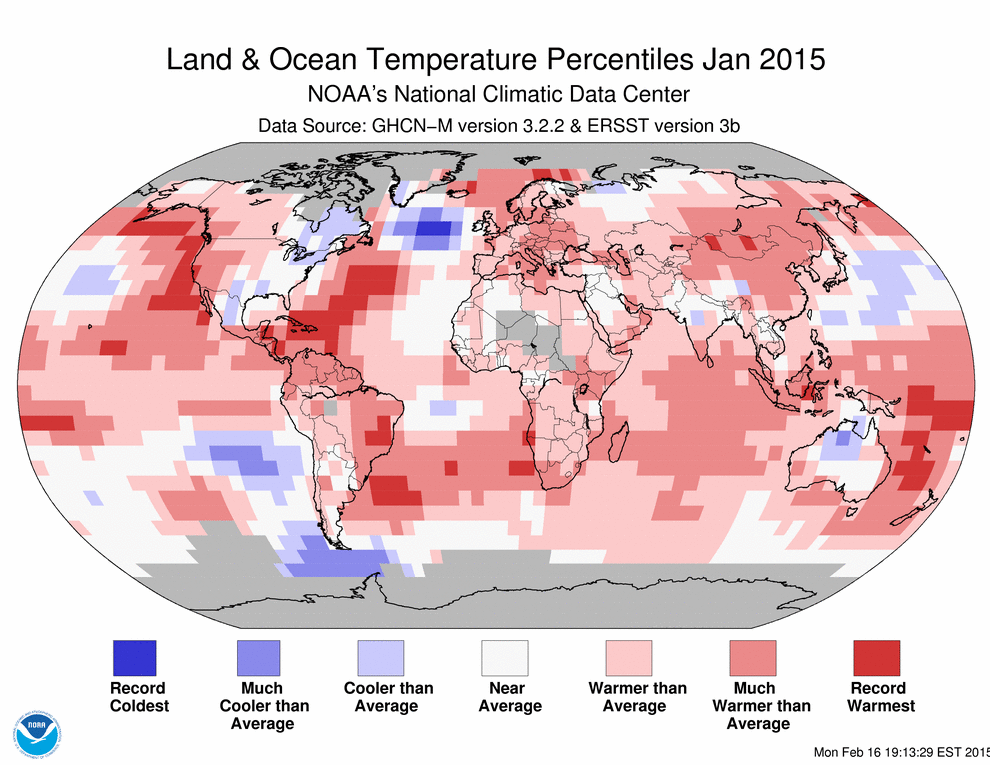
At the same time, NOAA noted that the Antarctic ice cover is at record-setting high levels. Since it is summer in the Southern Hemisphere, this may be due to increased melting off of the Antarctic continent or may reflect the unusually cold ocean temperatures that you can see south of South America. In the Arctic, the sea ice extent was the third smallest since records began in 1979.