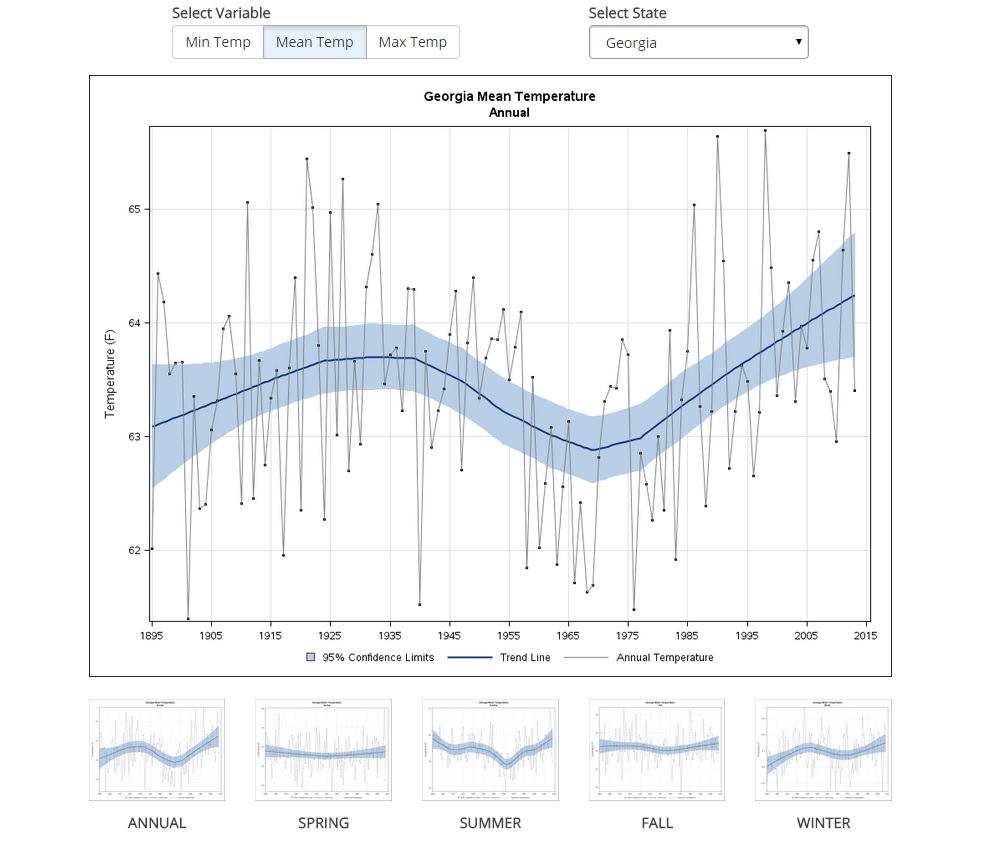
AgWeb published a story today on new temperature trend maps that were recently produced by the National Climatic Data Center (NCDC). These maps show long-term temperature trends for each state for 1895 to the present. You can look at both average temperature and maximum and minimum temperature separately. The graphs are also divided into seasonal graphs. An example of the display for Georgia is shown below but all states are available. No precipitation data are available. You can read the AgWeb story here. You can look at the graphs for your own area at https://www.ncdc.noaa.gov/temp-and-precip/state-temps/. For Georgia, the biggest changes are seen in summer minimum temperatures and winter maximum temperatures.