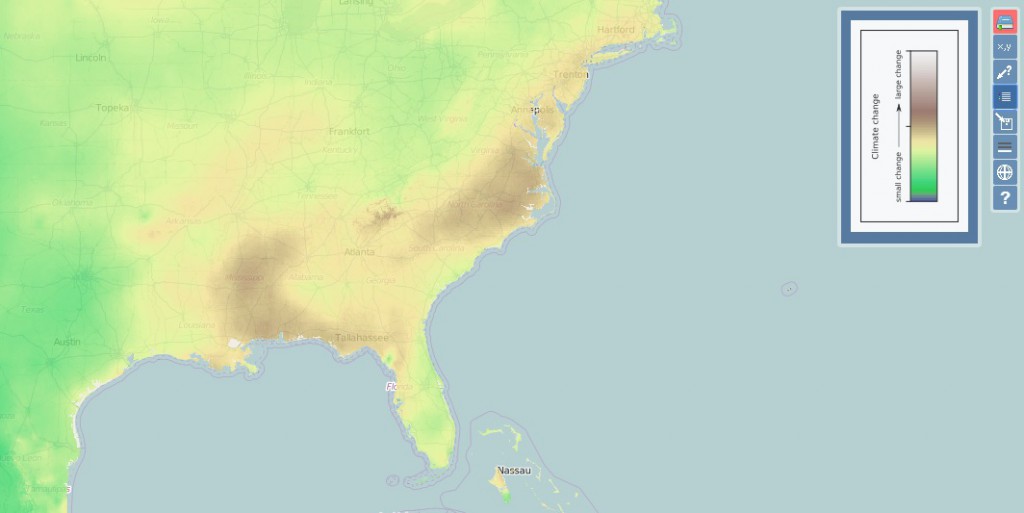
I love maps and was excited to discover this new mapping tool that allows you to look at climate diversity and change over time across the globe. It was designed by a University of Cincinnati professor and is interactive. You may want to look at the manual (red box at top right) to get the full benefit of the tool. You can read more about it in UC Magazine at https://magazine.uc.edu/editors_picks/recent_features/climatemap.html or go directly to the map at https://sil.uc.edu/webapps/climateex/.
Here is what the tool says it does: “ClimateEx (Climate Explorer) is an interactive web application for around the globe exploration of spatio-temporal changes in climate by means of the Climate Similarity Search . The user selects a location in the world and the point in time, examines a climatogram corresponding to this selection, selects a target point in time, and issues a query. In response to the query, ClimateEx generates a world-wide similarity map with colors encoding a degree of similarity between a query climate and local climates at the selected target time. With ClimateEx you can explore spatial variability of present-day climate and inspect climate trends without direct references to the numerical values of climatic variables.”