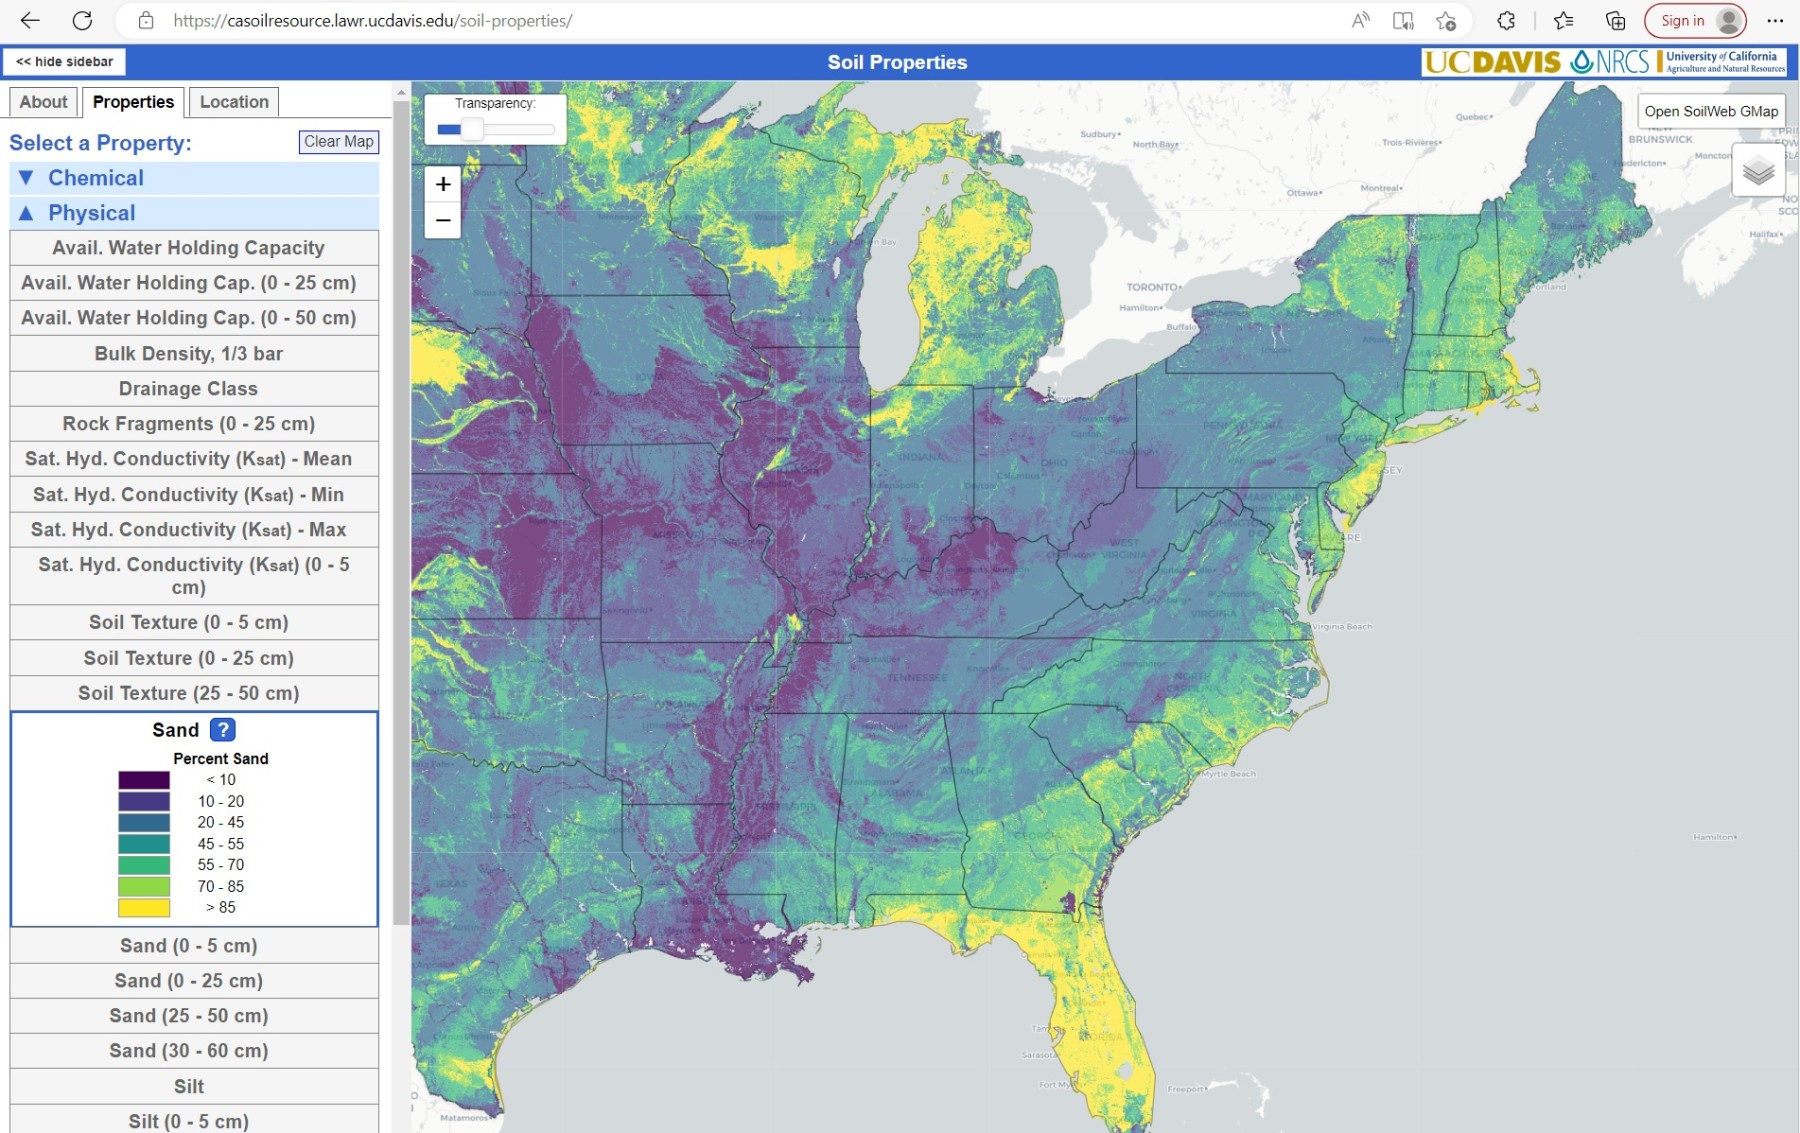
While the focus of this blog is on climate and agriculture, a good understanding of agriculture also requires knowledge of the soil that you are growing your crops in. I was intrigued to hear about this website that provides a way to do interactive mapping of a number of soil properties across the country at Soil Properties | California Soil Resource Lab (ucdavis.edu). In the map below it shows the percentage of soil that is sand, and you can clearly see the difference between soils above and below the Fall Line that runs through Alabama, Georgia, and the Carolinas. The Okeefenokee Swamp also shows up clearly. Give it a try for your location and see how accurate the soil characteristics are for your site.