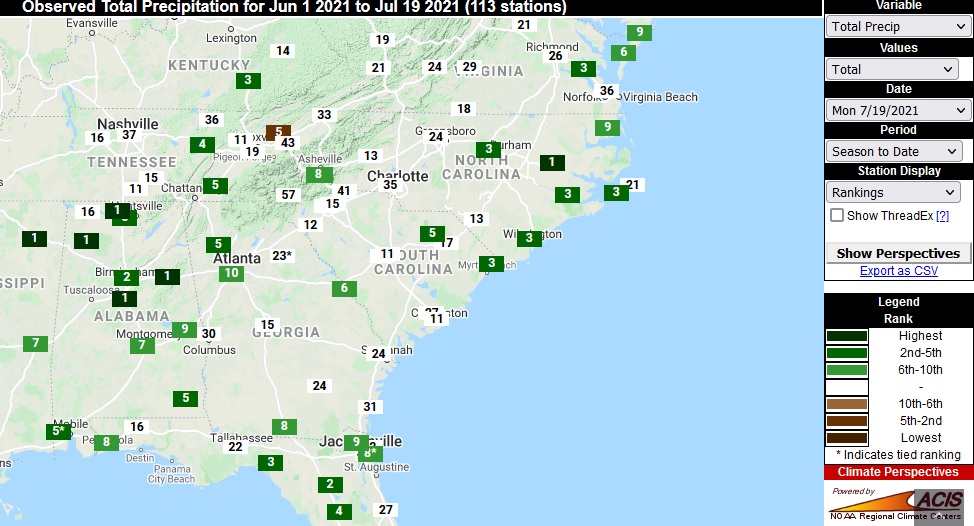
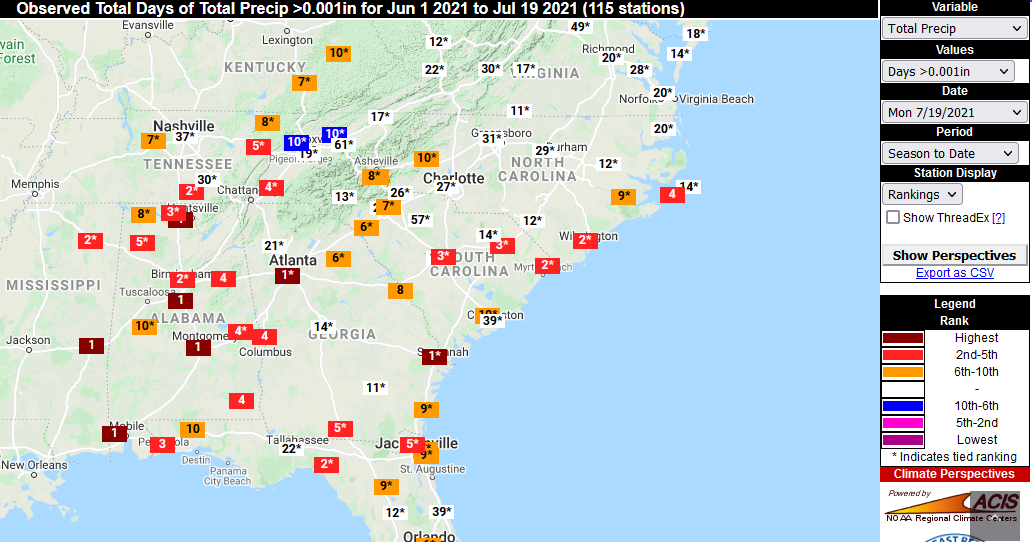
I am getting a lot of calls about the day after day of rain. It’s not just the amounts, which are sometimes large but often just a tenth of an inch or so. It is also the frequency, which is enough to keep farmers from being able to apply fungicides, growth inhibitors, and other treatments to their crops. These maps from the Southeast Regional Climate Center’s Perspectives tool show that not only are the rainfall amounts since June 1 in the top ten wettest at many locations, but the number of days with measurable rain are also in the top ten highest (note that these are not the long-term threaded records but individual station records). Thanks to David Zierden, the Florida State Climatologist, for pointing this out. You can do your own search at https://sercc.com/climate-perspectives/.