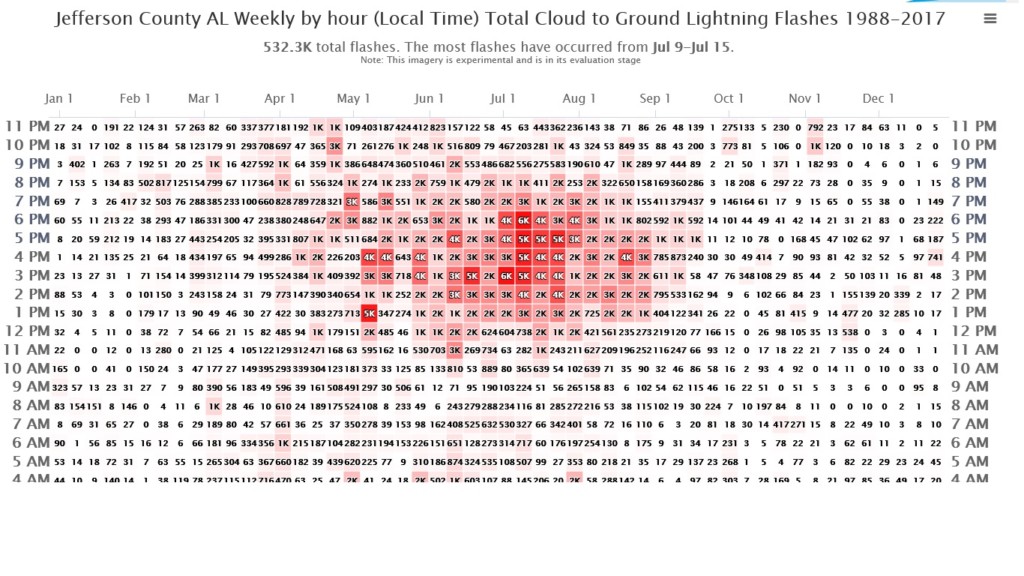
Here is an interesting product that I found online when doing a search for a climatology of lightning strikes. It is an experimental product from the Medford OR National Weather Service office and was developed to help with lightning-initiated wildfires. It shows a count or frequency table of lightning strikes by county, hour of day, and week of year for the 1988-2017 period. It covers the continental US. The web page has a 4-minute video that describes the product and a link to get to the data tables. Take a look at it and see what you think! https://www.weather.gov/mfr//lightning_climatology. The first table below is for Jefferson County AL (Birmingham) and shows the strong summer daytime thunderstorms in May through August from noon to 8 pm. By comparison, when I looked at my home of Kent County MI (Grand Rapids; second table), the lightning is much more evenly distributed throughout all hours due to more frontal thunderstorms in the summer, although the total number of strikes is much lower.