June 1 is the first day of climatological summer, which includes the months of June, July, and August. Climatologists use calendar months for seasons to make calculations of averages a little easier and to compare more easily with past historical records, which were calculated by hand before electronic calculators were available. Hope it’s a great summer for you!
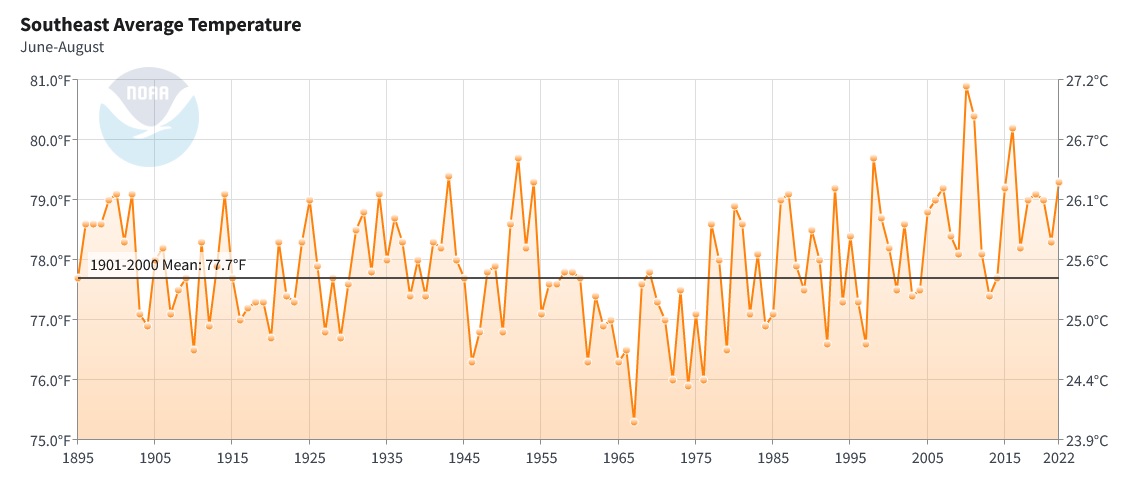
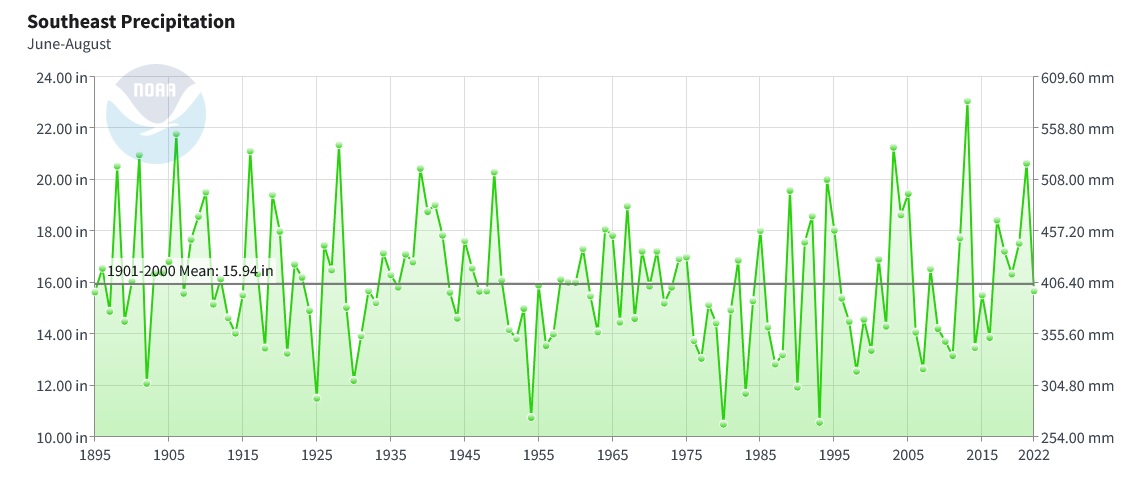
The time series graphs below show the June-August average temperature and total precipitation for the Southeast as a whole. You can see that summers have been getting warmer since about 1960. Both daytime high temperatures and nighttime low temperatures are rising, but the overnight lows are rising much faster due to increased humidity and a small contribution from increases in urban pavement, although most of the stations used in the analysis are located in rural areas. Precipitation is also increasing since the late 1970s but has become more variable, a problem for farmers who need reliable rainfall. You can make your own graphs for your location at https://www.ncei.noaa.gov/access/monitoring/climate-at-a-glance/regional/time-series/ .