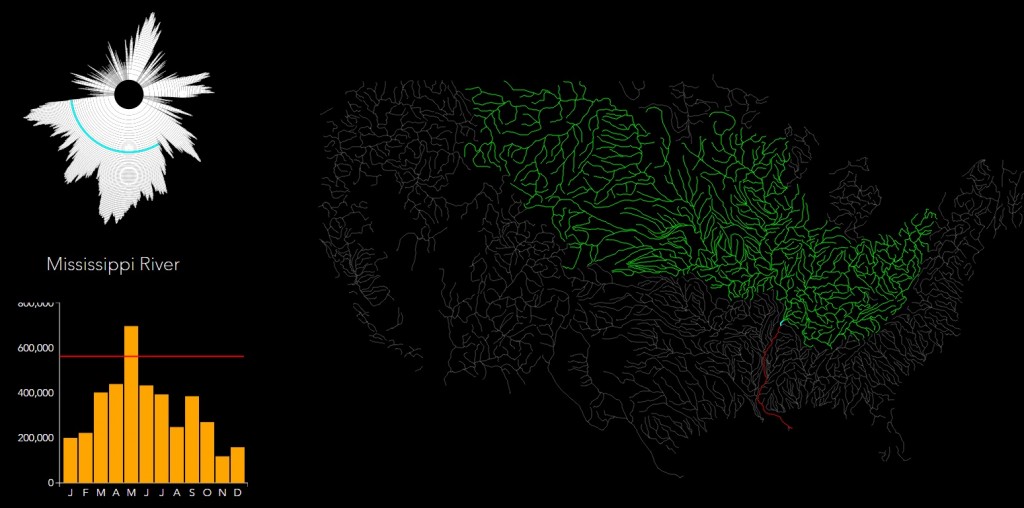
A friend of mine pointed out this interesting new web site from ESRI called Hydro Hierarchy. The web site allows you to look at the relationship between rivers and their drainage patterns across the US. A bar plot on the lower left shows the 2014 streamflow values. The radial graph on the top left shows how close the drainage area you are looking at is to the ocean.
It’s a lot of fun to play with just to see how all of the tributaries connect together and how flow changes down the stream. If you check out the ACF basin, you can see the big increase in rainfall in May 2014 from our very wet April 2014 across the Southeast. The map below shows the hydrograph for the Mississippi River last year. The web site is at https://maps.esri.com/rc/radial/index.html.