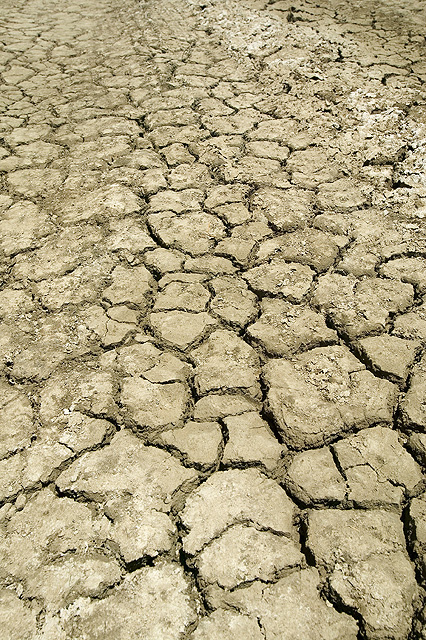
Do you ever get asked about where to get information on 50-year droughts? I got one this week from a fire chief who was looking to certify dry hydrants and needed to know what a 50-year drought looks like. While specific impacts of any drought on a pond or lake vary depending on drainage into the lake, surface area for evaporation, and soil type, you can get an idea of the reduction in precipitation due to a severe drought using a couple of drought atlas sources.
The National Drought Center has a Drought Risk Atlas at https://droughtatlas.unl.edu/. The US Army Corps of Engineers has a National Drought Atlas https://library.water-resources.us/docs/atlas/Atlasintro.cfm. Both of them can help to quantify how much precipitation is reduced in a 2% exceedance drought (which corresponds to a 50-year drought). For a location in southern Georgia, the estimated 12-month precipitation in a 50-year drought was 0.65 times the annual average precipitation, or a reduction of 35%.
If you have other sources that you use to answer this question, please mail them to me–I am always looking for better data sources!