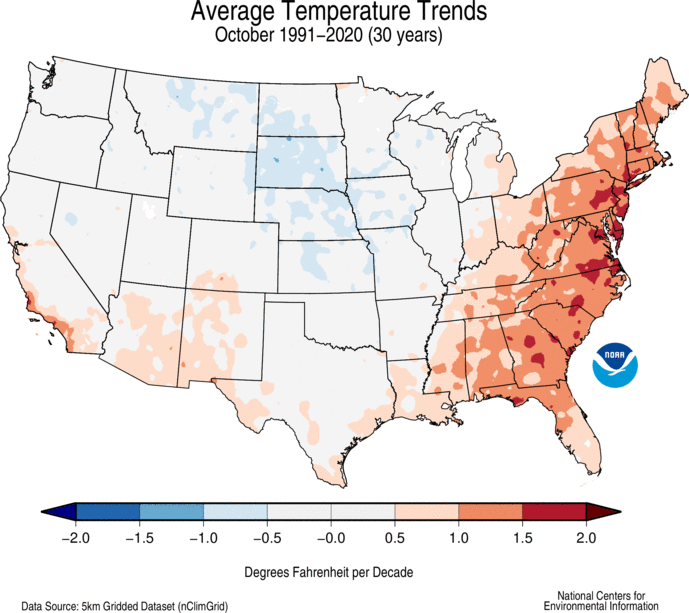
Are you interested in seeing how climate is changing across the US over time? This came up for discussion on a listserve that I follow today. Here is a good description of an NCEI product that produces maps of trends over time for the lower 48 states: https://www.climate.gov/news-features/blogs/beyond-data/duct-tape-and-seesaws-climate-trends-101. You can also go directly to the website which produces monthly maps of trends of average, max, and min temperature and precipitation at https://www.ncdc.noaa.gov/temp-and-precip/us-trends/tavg/ann. It shows monthly trends as well as an annual trend and includes both the most recent 30 year period and the full record since 1895. The trend for October for the last 30 years is shown below. Not all months show the same trend, and the short-term trends are often different than the long-term trend, too.