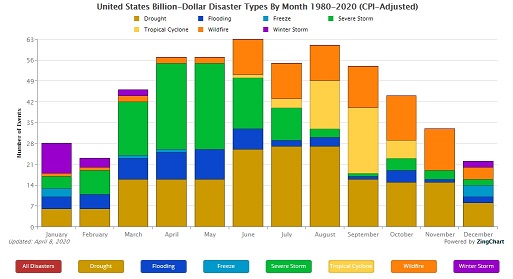
Here’s an interesting chart which shows how billion-dollar weather disasters change by month across the US (you can also break it down by regions and states). You probably will not be surprised to see that winter storm damage is highest in winter, freeze events in spring, and drought in summer. But the chart is still interesting because even though costly disasters from events like drought are more likely in the warm season, they are not zero in winter either. If you use this link at https://www.ncdc.noaa.gov/billions/climatology you can see what it looks like for your state and read off the numbers more easily.