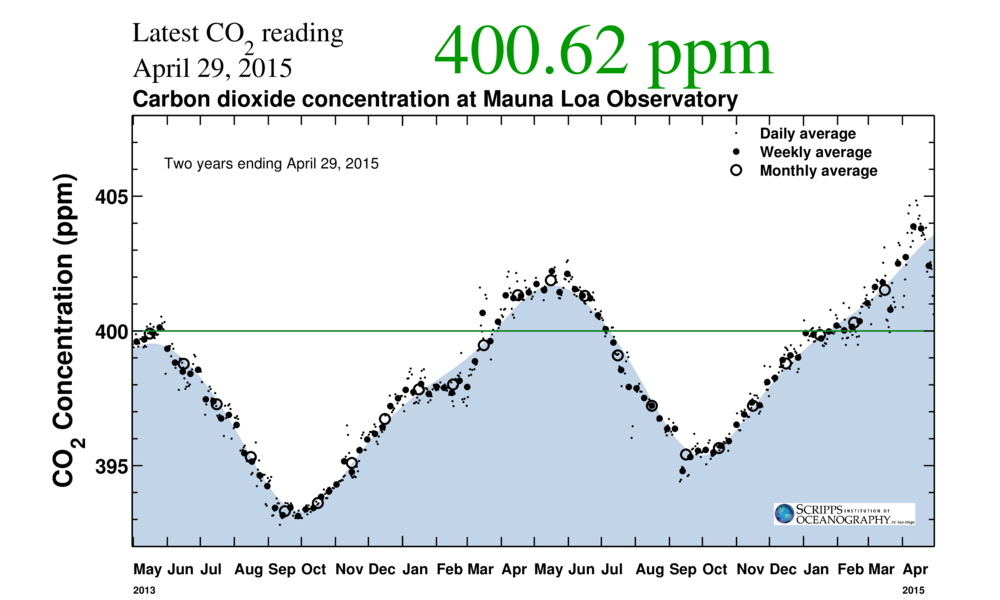
If you have looked at the Keeling curve for carbon dioxide concentration that I have shown in past blog postings, you may be wondering why there is a yearly cycle in the concentration of carbon dioxide. The graph below shows the last two years of carbon dioxide in the atmosphere, as measured on Mauna Loa in Hawaii. You can see that the amount of carbon dioxide grows until about April and then declines to a minimum near September, when it starts to rise again.
The reason for the curve is related to the unequal distribution of land and ocean in the Northern and Southern Hemispheres. There is a lot more land (and thus area for plants to grow) in the Northern Hemisphere than in the Southern Hemisphere, so when the NH plants are actively growing in April through September, they are removing CO2 from the atmosphere, lowering the concentration. At the end of the Northern Hemisphere growing season, plants go dormant and CO2 starts to build up again. Since there is less land and less area for plants to grow in the Southern Hemisphere, they can’t keep up with the loss of activity from the NH plants, and CO2 increases.