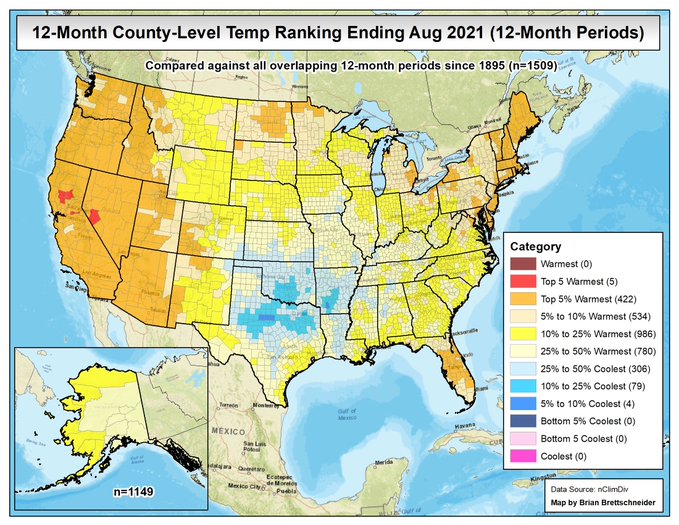
One of my favorite climatologists, Brian Brettschneider (@climatologist49 on Twitter) has provided a great set of two maps that show the last 12 months in historical context for the US. He compares the current 12-month period that just ended at the end of August to previous 12-month periods going back to 1895 to see how they rank. The maps show that for the Southeast, the last 12-month period ranked in the top 5-10 percent wettest of all years. The Florida Peninsula was the closest to normal along with parts of the Piedmont in Georgia and South Carolina. Temperature-wise, almost all of the region was in the top 25% warmest of all years in spite of the cold February, which you can see reflected in the very cold rankings of counties in the Southern Plains, including Texas. If you like looking at these kinds of maps, I encourage you to follow @Climatologist49 (he’s from Alaska) to see all the other amazing climate maps he comes up with.