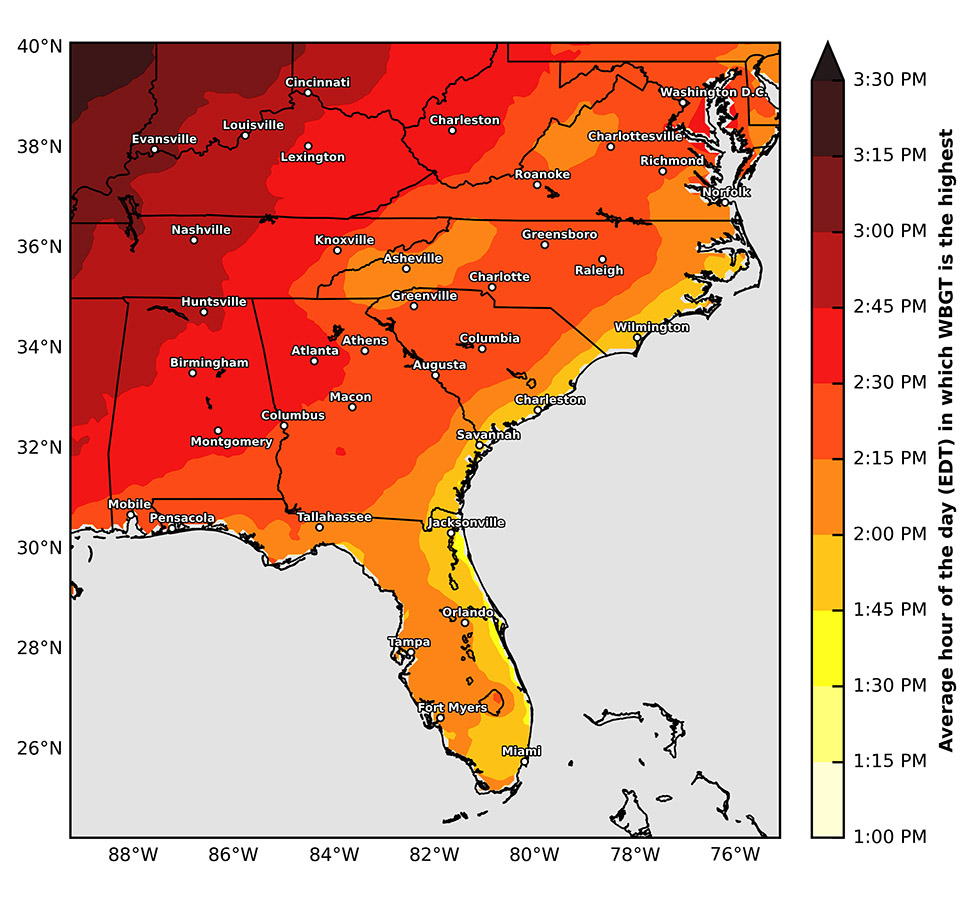
If you worry about excessive heat and humidity and its impacts on your outdoor workers or on your exercising students, you may be interested in this new climatology of Wet Bulb Globe Temperature (WBGT) across the Southeast. This set of maps from the Southeast Regional Climate Center provide month by month images of how WBGT varies across the region for various different temperature thresholds. They also provide maps showing the time of day and time of year when the WBGT values are the highest. These could be used to help schedule work breaks or timing of football practice, for example. You can view them all at https://sercc.com/wbgt-climatology/.