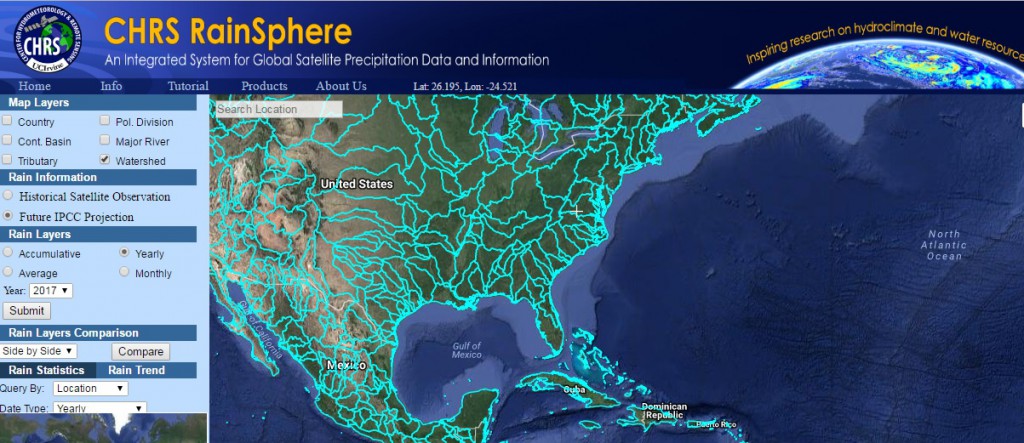
A new mapping tool that allows you to look at historical and projected trends in precipitation from satellite and ground-based data is now available at https://rainsphere.eng.uci.edu/. According to a description of the tool in the Bulletin of the American Meteorological Society (link), CHRS RainSphere was designed as an educational tool that allows users to quickly and easily conduct analyses of historical and future precipitation at spatial scales that range from highly local to global and at daily, monthly, or annual time scales. I’ve played around with it and it looks like it could be very useful for finding trends in precipitation. There is a YouTube video tutorial on it at www.youtube.com/watch?v=eI2-f88iGlY&feature=youtu.be but it also seems fairly intuitive to use.