The content on this page is retained only for recordkeeping, historical reference, or research. These materials are preserved in their original form and may not meet current WCAG 2.1 AA accessibility standards.
These archived materials are not required to be remediated. However, we remain committed to equitable access. If you need an accessible version of any archived item to participate in our current programs and services, we will provide one when feasible upon request at caesweb@uga.edu.
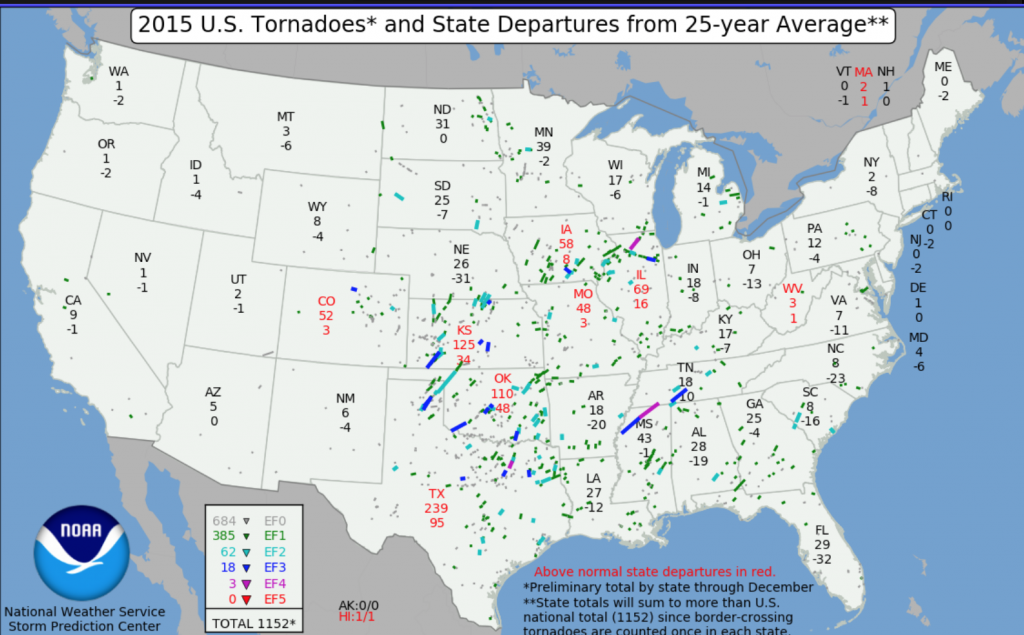
Here is an image from NOAA’s Storm Prediction Center that shows a US map of the tornadoes that were observed across the United States in 2015. There are also state-by-state statistics showing which states received more tornadoes than average and which received less. Note that all of the Southeast experienced below-normal numbers of tornadoes last year.