MGLOG 2.0 is here! This new system is well worth the wait! We are enjoying several new features and an overall makeover, but no worries, all the basic functionalities you are used to if you’re a veteran MGEV are the same.
Upon logging in, you’ll notice that MGLOG looks different, like the updated red and black color scheme. Rather than accessing menu options down the right side of your home page, you now have a red toolbar across the top with dropdown options. You’ll also find a few more charts and graphs that will help you visualize your progress and efforts.
We’re also pretty excited to resolve that glitch we had with mobile devices. Many of you struggled with saving entries, but that will no longer be a problem with the new system. It’s about time, right? While the new system is more mobile-friendly, we still encourage use of a laptop or desktop computer for the best user experience.
In the next few blog posts, we’ll explore the new system together. Let’s start by looking at the home screen you see after logging in.
Your MGEV MGLOG Home Page:
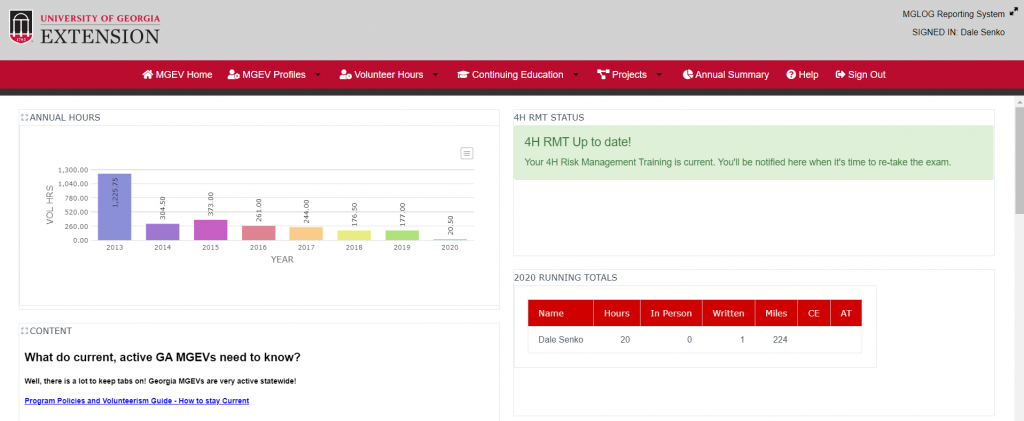
Your homepage is made up of several applications that can be opened and viewed in full screen using the expansion icon next to the application title. These include:
- Annual Hours: This is a bar graph of your annual volunteer service hours for each year you have logged hours (displays data 2013 – current year; MGLOG launched in 2014). The graph can be exported in multiple formats.
- 4H RMT Status: You will be prompted to take the training for the first time, re-take the training, or notified that your status is up-to-date. RMT is completed through MGLOG on an annual basis beginning on July 1 each year.
- Content: This is a link to the GA MGEV webpage where you can find the Volunteerism Guide and Program Policies among other volunteer resources like Advanced Training and Thoughtful Thursday details.
- 2020 Running Totals: This is a snapshot of data you have entered for the current calendar year.
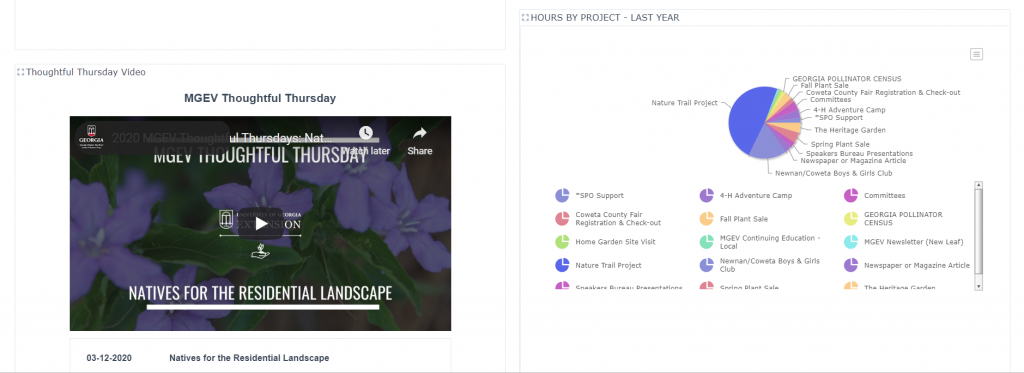
- Thoughtful Thursday Video: You can view all recorded 2018-present Thoughtful Thursday (TT) webinar sessions through this application. You may wish to expand the window to full screen for a larger video view. The most recent TT is displayed on the homepage. Use the View All button to watch previous sessions. Then, record this time as continuing education.
- Hours By Project – Last Year: This pie chart displays your logged volunteer service time by project for the previous calendar year. The graph can be exported in multiple formats.
- Top Ten Lists: Click on each tab to view each leader board displaying the top ten counties for volunteer service and continuing education hours.
- Totals: This list displays the top ten counties for total number of MGEVs reporting and total number of volunteer service hours reported by those MGEVs.
- Averages: This list shows a top ten ranking of the total average hours reported by MGEVs, which illustrates that small programs are doing big things!
- Edu Totals: This list displays the top ten counties for total amount of reported continuing education hours and the number of MGEVs reporting those hours.