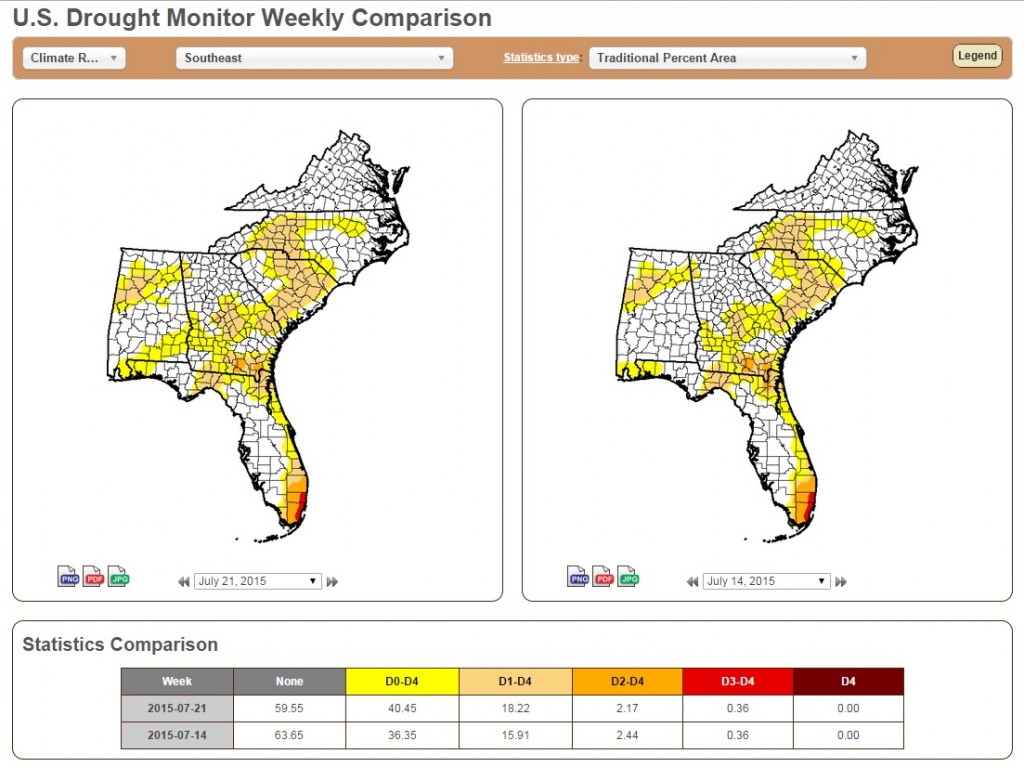
Each week on Thursday morning the National Drought Monitor is updated to reflect the latest drought conditions across the US. You can find a comparison from one week to the next at https://droughtmonitor.unl.edu/MapsAndData/WeeklyComparison.aspx. But do you know what the different drought categories mean?
The CoCoRaHS group has put together a neat animated YouTube video which explains the different classifications and how frequently they occur. It is about six minutes long and can be found at https://www.youtube.com/watch?v=i7F6QwRqyVI&feature=youtu.be.