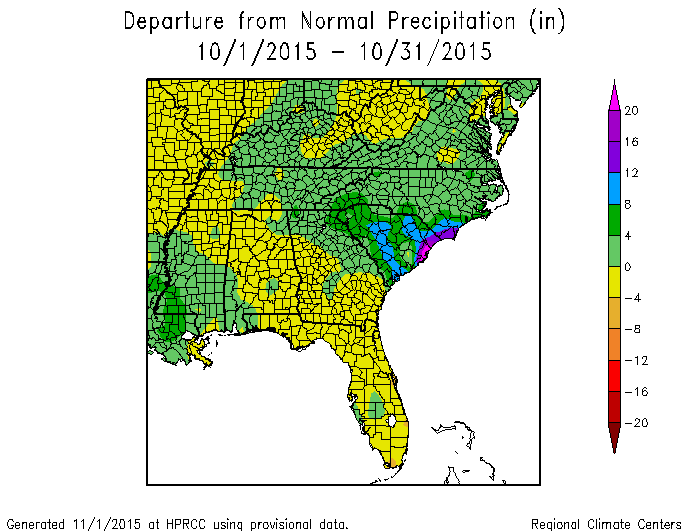
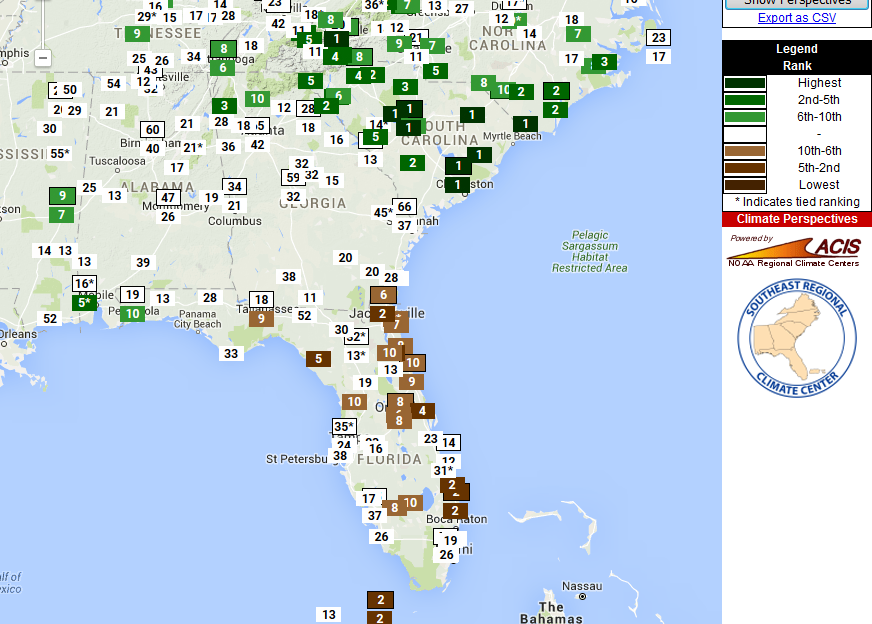
The preliminary climate maps for October 2015 show a division between the Carolinas and Virginia, which were wetter than normal, and Georgia, Florida and Alabama, which were mostly drier than normal. The wettest area was the coastal area of South Carolina with a small extension into North Carolina due to the flooding event early in the month. This split also shows up in the SERCC Perspectives precipitation ranking map, which shows that stations in SC were generally among the top ten wettest while stations in Florida were in the top ten driest.
Areas that received a lot of rain were generally also cooler than the long-term average due to the increased cloud cover, while the drier areas were also warmer than normal.