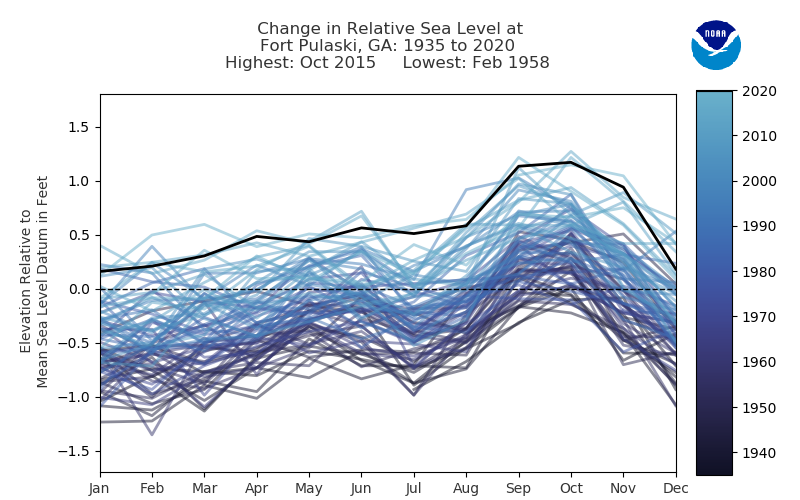
This week, NOAA announced a new interactive sea-level mapping tool on their Climate.gov page. The tool allows you to use an interactive map to see how sea level has changed over time at a number of sites along the coast. Once you pick one of the locations, it displays a graph showing how sea level has changed from the start of the record to the present. You can download a graph that shows the changes year by year, such as the one below for Fort Pulaski, Georgia. More information and the interactive map can be found here.