The content on this page is retained only for recordkeeping, historical reference, or research. These materials are preserved in their original form and may not meet current WCAG 2.1 AA accessibility standards.
These archived materials are not required to be remediated. However, we remain committed to equitable access. If you need an accessible version of any archived item to participate in our current programs and services, we will provide one when feasible upon request at caesweb@uga.edu.
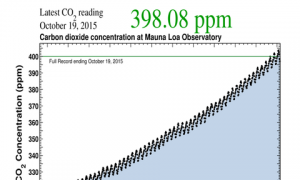
Here is a new animated graphic which shows how the global carbon dioxide level is changing at the same time that emissions and volcanism are changing. As you watch the time change, you can see the CO2 level creep up, especially in response to emissions. The impacts of El Niño and La Niña are also shown. You can see it at https://folk.uio.no/roberan/t/CO2_drivers.shtml.