Do things seem really dry where you are? How much should you water your lawn or irrigate your crops? There are a number of commercial products out there that can help you determine this, but one simple method that is available for free is the Lawn and Garden Moisture Index, a daily map put out by the Alabama State Climatologist based on estimated rainfall from radar. This map tells you whether your lawn and garden have enough moisture or if more needs to be added. This is one of a number of useful products available on AgroClimate.org, a website developed by the Southeast Climate Consortium, a group of eight universities around the Southeast.
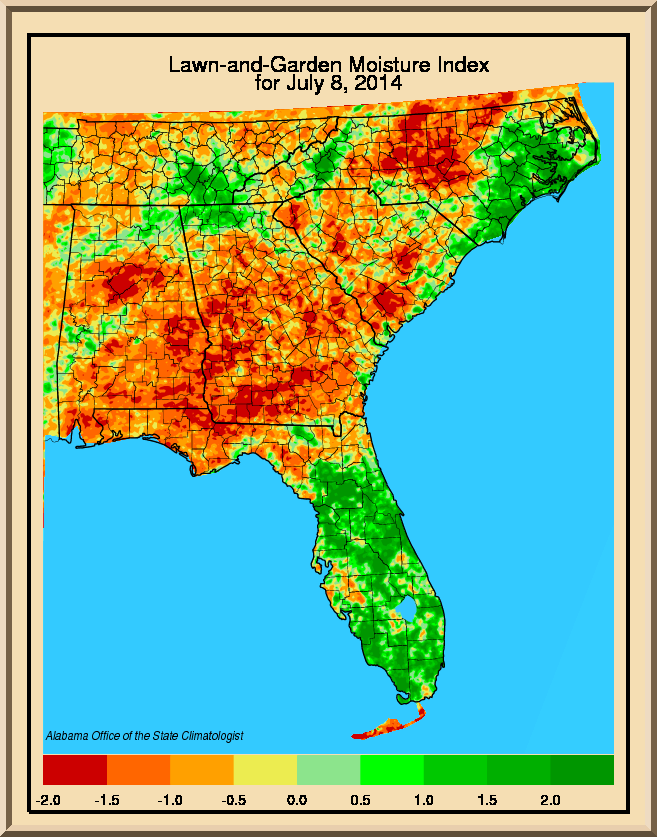
This map shows the areas with surplus water in greens (no need to water or irrigate there) and areas with a water deficit in oranges and reds. The darkest red areas are almost 2 inches short of water, including a large portion of Georgia. If this situation continues, then the Drought Monitor is likely to add D0, abnormally dry conditions, to the next weekly Drought Monitor map. Areas with deficits of an inch or more should be irrigated to help alleviate the dry conditions and keep lawns and gardens healthy.