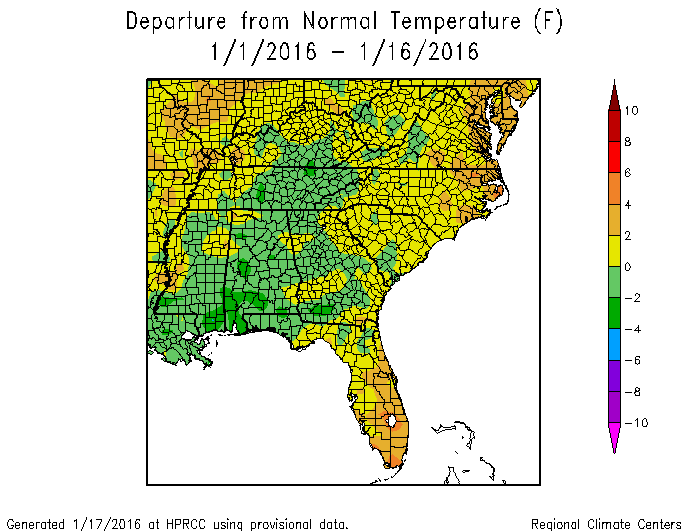
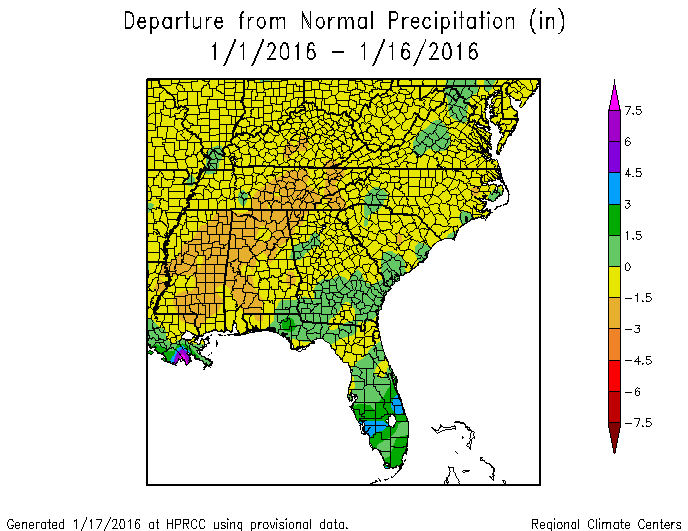
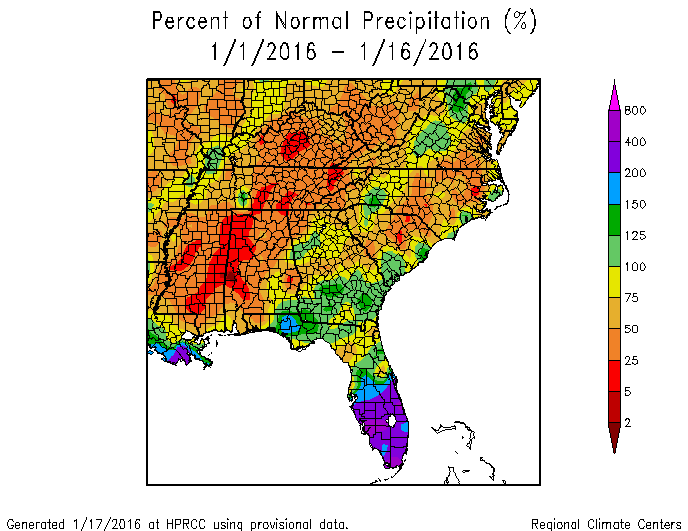
It’s halfway through the month, so let’s take a look at the temperature and precipitation so far. The maps from the High Plains Regional Climate Center show that for most areas of the Southeast, the temperatures are fairly close to normal. The areas that are most above normal are the southern peninsula of Florida and eastern North Carolina. The rainfall is more variable and show that the wettest area is southern Florida while the driest region is in Alabama and Mississippi. This is highlighted even more by the “percent of normal” map on the bottom, which shows that southern Florida is three to four times wetter than normal while the dry regions are less than 20 percent of normal precipitation.