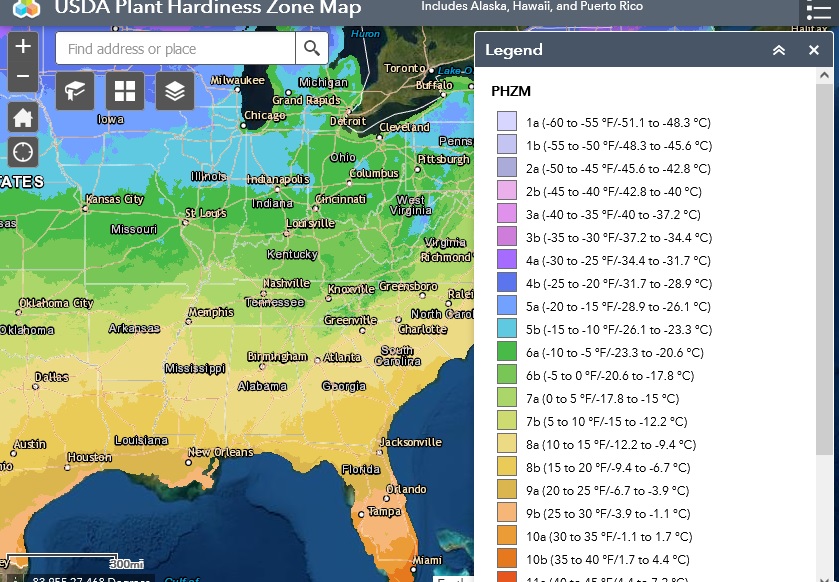
Do you know what plant hardiness zone you live in? It’s very useful information when you are trying to decide what plants to grow in your garden. The USDA plant hardiness zones are related to the average lowest minimum temperature at a location. Over time they have changed a bit as temperatures have gotten warmer and the maps have updated. Here is an interactive version of the map that allows you to zoom to street level. There is a color key for the map, but if you have trouble differentiating between all the colors, you can click on the map at your location of choice and a pop-up should indicate the zone at that location. Give it a try! I can really see the effects of Lake Michigan on Grand Rapids, MI (where I grew up) to Madison, WI (where I went to graduate school). The lake provides warm enough temperatures for fruit crops to thrive along the western coast of Lower Michigan where it is too cold for crops like peaches to grow in Wisconsin.