The content on this page is retained only for recordkeeping, historical reference, or research. These materials are preserved in their original form and may not meet current WCAG 2.1 AA accessibility standards.
These archived materials are not required to be remediated. However, we remain committed to equitable access. If you need an accessible version of any archived item to participate in our current programs and services, we will provide one when feasible upon request at caesweb@uga.edu.
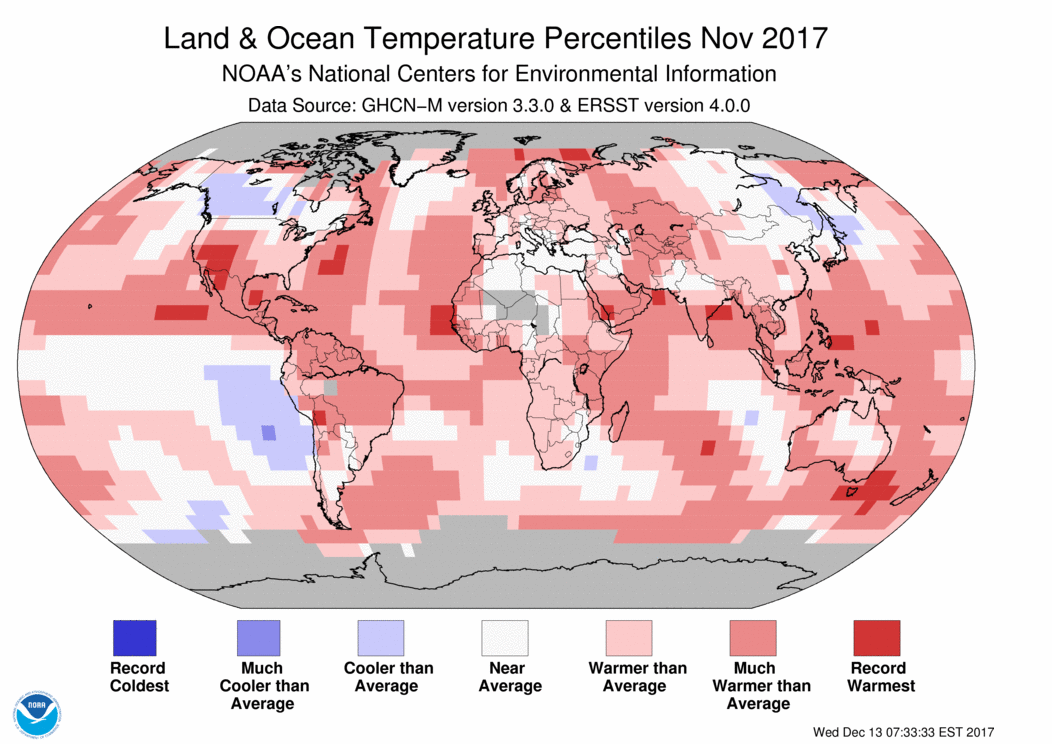
The global climate maps for November 2025 are now available from https://www.ncei.noaa.gov/access/monitoring/ghcn-gridded-products/maps/201711. They show most of the planet was warmer than normal with a number of areas the warmest everywhere. The precipitation map shows that most of the eastern United States was drier than normal except the area right around the Great Lakes. The Southeast was also drier and warmer than normal in spite of the cold outbreak mid-month.