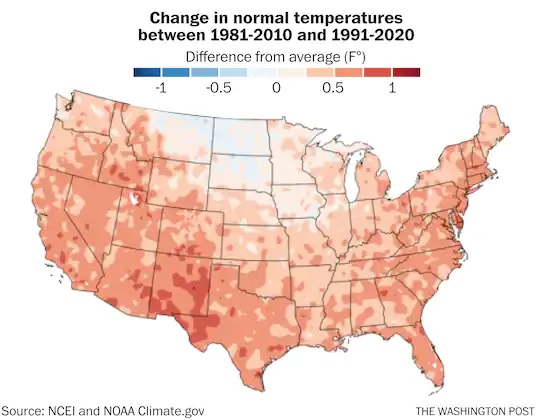
Today, NOAA released their new climate normals for the 1991-2020 period. These 30-year averages replaced the old normals that covered the period from 1981-2010. This is done every ten years to provide a consistent period of time for use in comparing monthly and annual climate information. There have been a number of news stories about this. Here is one from the Washington Post that explains what normals are and why they are updated every ten years along with a description of how the new normals compare to the old ones. The maps below show the patterns of the changes across the contiguous 48 United States. Note that as expected, nearly all of the country saw their average temperature increase, with the exception of a small area of the northern Great Plains. This is not surprising because of the rising temperatures we are seeing in the US as well as the rest of the world due to global warming caused by increasing greenhouse gases in the atmosphere. Here in the Southeast temperatures increased by between 0.25 and 0.75 degrees F.
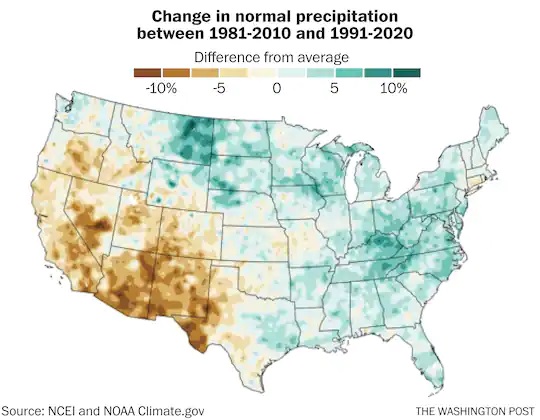
The changes in precipitation varied quite a bit across the country. Generally the West got drier while the East got wetter. Here in the Southeast most areas got wetter, with only a small area of southeastern Georgia that got slightly drier.
If you would like to read more, here is another great article in The Hill.
If you would like to see the changes for your location, you can find an interactive map providing links to individual stations from Jared Rennie at https://www.arcgis.com/home/webmap/viewer.html?webmap=2f745679483f4d6ebca9c6d5bdd39fca&extent=-161.4677,1.9981,-26.3798,60.8337.