I was astounded to see how much rain fell this weekend due to the storm which passed through the region. The UGA weather station at Seminole State Park recorded 7.87 inches of rain in the far southwestern part of Georgia, and another station at Alma in Bacon County recorded 7.66 inches. Both of those fell in less than 24 hours. I have seen some reports of over 10 inches of rain in isolated spots, and many of those reports also indicated that the rain fell in just a few hours, not over the entire day. We seldom get this much rain from non-tropical systems, although obviously it does happen. This is going to cause significant problems for producers in southern Georgia and surrounding areas due to standing water, washing out of planted seeds, and drowning of pastures, although dry conditions leading into the storm may have helped a little in reducing the worst effects. I can also imagine that all that water is going to keep soil temperatures down for a while, making planting difficult even if farmers can get into their fields.
How do you document the amount of rain that fell in your area? Of course, your own rain gauge is the best measure of local conditions, as long as it is a quality rain gauge that is properly sited. Other weather stations can also provide useful information if they are within a few miles of your location. But if you are far from any observation, then your best approach may be to use radar-estimated rainfall maps to help show how much rain fell at your location. The best source of this information is most likely the National Weather Service’s Advanced Hydrologic Prediction Service (AHPS) at https://water.weather.gov/precip/. This site provides a daily 24-hour rainfall amount from 7 am to 7 am Eastern Standard Time (8 am EDT) across the US on an interactive map that allows you to plot county boundaries which allow you to see the rainfall variations across the region on that day.
Note that the radar-estimated rainfall is not perfect, because radar estimates can be affected by the presence of hail (which is a very effective reflector of radar beams) and high-intensity rain bands, which may cause the radar to underestimate the heaviest rain. The daily map is calibrated based on surface observations, so these errors are reduced by ground truth, but are not completely eliminated because there are just not enough observations available to provide surface data everywhere (if there were, we would not need the radar estimates).
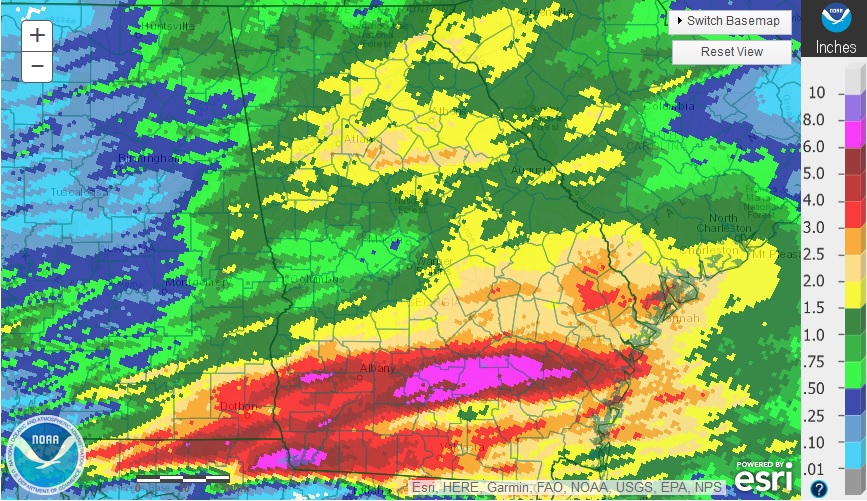
The map below shows the 1-day rainfall amounts across Georgia reported on the morning of April 25, 2021. It is usually available an hour or two after the closing time of the map, which means mid- to late morning during daylight saving time. This only includes the rain that fell starting on April 24 after 8 am EDT, so some of the rain that fell earlier than that in western Georgia may not be included on this 1-day map. But the site has the option to produce maps for other periods such as 7 days, 14 days, etc. so you can use a 7-day map to capture the total rainfall from this storm, since it has been quite dry in the Southeast for the past week. For comparison, the rainfall map from the UGA weather network for April 24 (midnight to midnight) is shown below. They don’t look exactly the same, since the UGA map is based on just the 87 stations in the network around the state and is smoothed in the graphics package, and of course they cover different time periods, but they are surprisingly well correlated, all things considered.