For those of you who are wondering whether or not our La Niña forecast for this winter has verified, here are the maps showing the temperature and precipitation anomaly patterns from October 1 to the present. Looks like a pretty classic La Niña to me, with warmer and drier conditions showing up across most of the Southeast, as predicted. Other parts of the US are pretty consistent with this pattern, too, although there are a few exceptions.
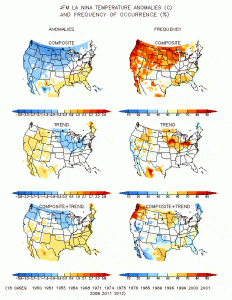
In the climatology maps below, the lower left map shows the combination of La Niña and trend for January through March. You can go to https://www.cpc.noaa.gov/products/precip/CWlink/ENSO/composites/EC_LNP_index.shtml to find other months for comparison.


