The end of the year has come and gone and now we are both looking back to the past and looking ahead to what will happen in the next growing season. I want to take a few minutes to highlight the last year’s climate and to look forward to the next year. NOAA will publish statewide statistics in a week or two.
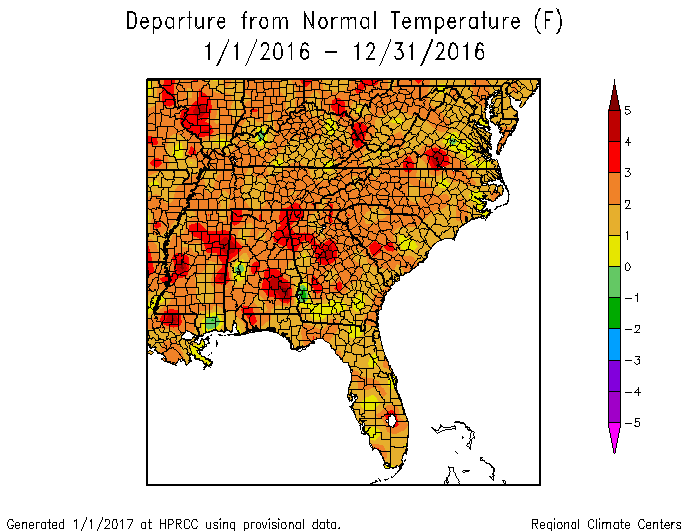
The map below from the High Plains Regional Climate Center shows that for most of the Southeast, temperatures for 2016 as a whole were well above normal. The only exception was a small patch of four counties in southwest Georgia that were cooler than normal. As you might expect, the areas with the highest average temperatures were generally also the areas that were the driest (we’ll get to that in a minute). When there is no moisture in the soil, all of the sun’s energy goes to heating up the surface rather than evaporating water, and so the warmer temperatures are not surprising. The warm temperatures were especially apparent in the July through September period in the second half of the growing season.
Atlanta set its all-time highest annual temperature with 65.9 F, beating out the previous highest in 2012 by 0.3 F. Atlanta has 138 years of record. Savannah had its second warmest year and Athens tied its second warmest. Macon was the third warmest in its record. Augusta tied its 9th warmest and Columbus its tenth warmest, according to the records from the Southeast Regional Climate Center’s Perspectives tool. This in spite of the fact that few daily high records were set during the year, and very few days were at or above 100 F, unlike other years with warm summers like 2007.
Every month except January and May were above the 20th century average temperature, most months by several degrees. January was only 1.0 degree below the 20th century average and May only 0.2 F below. The April 1 through October 31 main growing season temperature was tied for the warmest on record with 2010 and 1925 at 76.7 F.
One of the surprising things about the temperatures this growing season was how consistently above normal they were in maximum and minimum temperatures even though very few records were set. Of the main National Weather Service sites, Atlanta, Athens and Macon set all-time records for the number of days this year with maximum temperatures above 85 F. Augusta was ranked 4th, Savannah 10th and Columbus 11th in the number of days above 85 F. For the annual average temperature, Atlanta was the warmest on record, Athens and Savannah second, Macon third, and Columbus tied for 10th warmest. Athens set a new record streak of 52 days at or above 90 F and Atlanta set a new record for minimum temperatures with 106 days having a minimum temperature at or above 70 F.
Precipitation across the state was highly variable during the growing season. The major contributors to the rain (and lack thereof) were the three tropical systems that moved through the area. Hurricane Hermine crossed across the southeast part of Georgia from the Gulf to the Atlantic at the beginning of September, bringing needed rain to those areas but largely skipping the driest areas in the northern part of the state. Tropical Storm Julia moved along the coast in mid-September, dropping additional rain on those areas. And of course Hurricane Matthew drove up the East Coast, producing copious rain in the eastern part of the state before dropping flooding rains in South and North Carolina in early October, causing tremendous problems for farmers there.

You can see the traces of those three storms in the pattern of rainfall across the Southeast, with areas under the tracks of the storms receiving plenty of rain while other areas were left high and dry. The only areas with above normal precipitation were in the swath of counties stretching from southwest corner to the east central area from Hermine and the heavier rain along the coast, which was mainly from Matthew. Since up to 30% of our summer rainfall normally comes from tropical systems, it’s no surprise that the areas outside of the tropical storm tracks went into drought.
Another thing that was surprising was the length of dry spells at many locations across the Southeast this summer. Many locations had well over a month of little to no rain at all. If you look at the counts of days with no measurable rain, Atlanta, Cedartown and Rome were at a record high number, Savannah was 8th, Macon was tied for 11th, Athens was 16th and Columbus was 19th.
The impact of the lack of rainy days shows up in the yearly rankings for total precipitation as well. Rome was the second driest year in 113 years of record, Columbus was the 5th driest on record in 107 years, and Macon the 6th driest in 117 years of record. Athens and Atlanta received local convective rain events during the summer which dropped their annual totals out of the top ten. The detailed map of radar-estimated rainfall departures is shown below.

Drought conditions across the year grew dramatically as the warm and dry conditions affected local climate. The drought started in northeast Georgia but expanded rapidly westward so that the worst impacts occurred in northwest Georgia. The timing of the extremely dry conditions hit right at the height of corn pollination and resulted in the almost complete loss of the corn crop there. Farmers used the corn plants for animal feed because the pastures had also gone dormant because of the lack of rain. Over the course of the summer the drought expanded southward into southwest and south central Georgia but pulled back at the end of the year due to rains which began in early December and the end of the growing season. I expect further reductions in the drought over the winter as more rain falls and cold temperatures keep evaporation down.
What can we expect for the next growing season? We are currently in a weak La Niña, which is having some effects on Georgia’s current climate pattern. In a weak La Niña like this one, the effects are mainly seen in southern Georgia and south into Florida. La Niña causes warmer and drier conditions than normal in most winters when it is strong, but the effects are less noticeable in years when it is weak, so while warmer than normal conditions are still being seen across Georgia, the driest conditions this year are in the southern part of Florida and southern Georgia is getting hit with rain.
As the La Niña continues to decay, other weather factors will come into play. Our best bet is that above normal temperatures are likely to continue through the next four seasons, due in part to La Niña but mainly because of long-term warming trends we have seen since the 1970s. Individual cold outbreaks may still happen though since the atmospheric circulation pattern is quite wavy, leading to occasional periods of very cold temperatures. Dry conditions have a slightly above average chance of continuing through early spring, but after that there is no skill in the prediction. As neutral conditions take over in late winter, the chance of a late frost increases, especially this year with the high variability in temperature we are seeing as the polar vortex shifts across the North Pole and sends surges of frigid air south towards us. Tropical seasons during neutral conditions are also likely to be more active, which could bring more rain to us during the latter part of the growing season, but depends critically on where the storms travel (as we saw this year). The next year—perhaps the tropics will swing back towards an El Niño. We won’t know this until mid-summer, but early signs look promising. Stay tuned!
If you would like to see updates of the maps above, here are some links for you:
High Plains Regional Climate Center maps: https://www.hprcc.unl.edu/maps.php?map=ACISClimateMaps
Climate Prediction Center’s outlook maps: https://www.cpc.noaa.gov/products/predictions/multi_season/13_seasonal_outlooks/color/churchill.php
NOAA’s radar-estimated rainfall: https://water.weather.gov/precip/
You might also like to visit these resources:
Southeast Regional Climate Center’s Perspectives tool helps determine rankings: https://www.sercc.com/perspectives?user=true
IRI ENSO (El Nino/La Nina) forecast: https://iri.columbia.edu/our-expertise/climate/forecasts/enso/current/
AgroClimate has tools that can help identify yield potential for a variety of crops for El Nino versus La Nina years: https://agroclimate.org/tools.php
You can also contact me at 706-310-3467 or pknox@uga.edu for more information, or visit my web site at https://gaclimate.com.