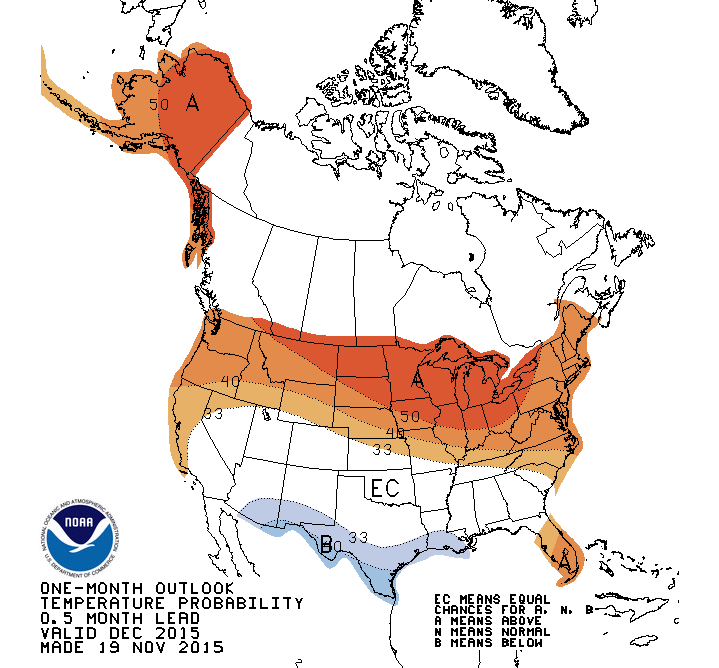
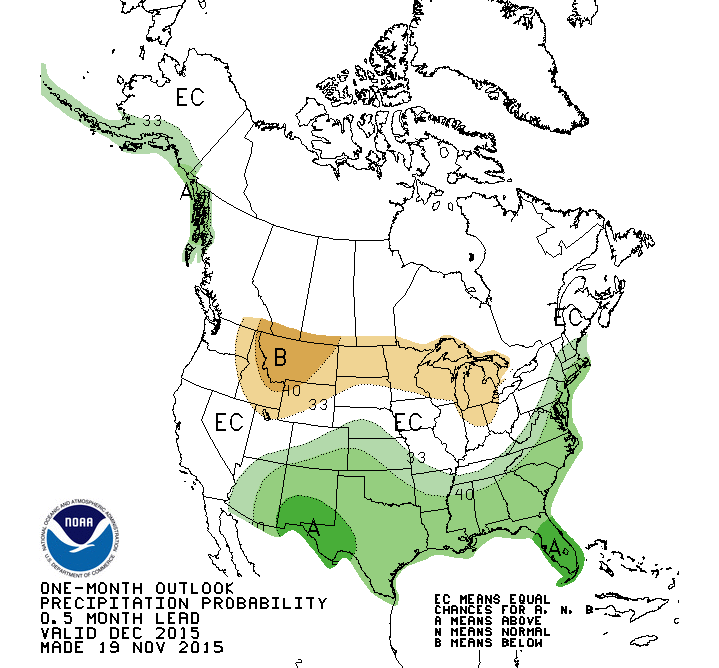
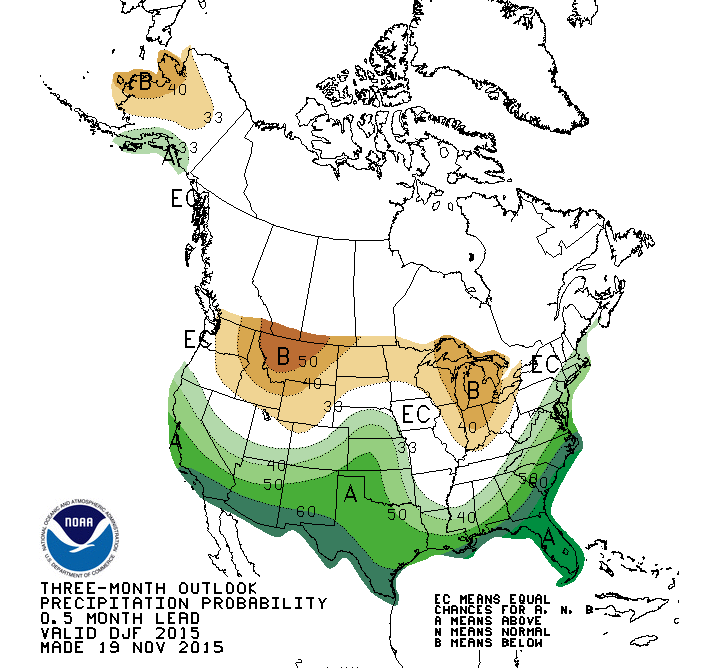
The Climate Prediction Center posted its latest outlook maps yesterday for December and December through February. The maps are shown below.
To interpret these maps, you need to know that the probabilities start out with an equal chance of below normal (33.3%) or lowest third of all values, above normal (33.3%) or upper third of all values, and near normal (33.3%) or middle third of all values. So if the maps show EC for Equal Chances, that means that there is an equal chance of the monthly value being in any of the three categories. In other words, they really don’t have an indication of any particular temperature pattern and you should use climatological ranges of values for what to expect. EC does not indicate the temperatures will necessarily be near normal, just that it has an equal chance of value.
If there is a shading on the graph, then the distribution is tilted towards one or the other. So for southern Florida precipitation in December, the darker green indicates a 45% chance of top third wettest, with the remainder of 33% chance of middle third and 22% chance of bottom third wettest. Even with a strong likelihood towards wetter or drier, though, it still does not say how much above or below normal the month will be.