On paper, 2014 was close to an average year climatologically for Georgia. The annual average temperature was 63.0 F, just 0.4 F below the 1901-2000 average. The annual total precipitation was 51.13 inches, just 1.06 inches above the average. Both of these are well within the range of what is considered a “normal” year. But within the year there was a lot of month-to-month variation, which helped to develop drought in some areas of the state during the growing season. The wet fall helped eliminate the dry conditions from the state, however, leading to favorable conditions going into next growing season.
The temperature departures for each calendar month are shown in Figure 1. In general, the first quarter of 2014 was colder than average, the growing season from April through September was very close to normal, and the last quarter was highly variable, with November much colder and December much warmer than average.
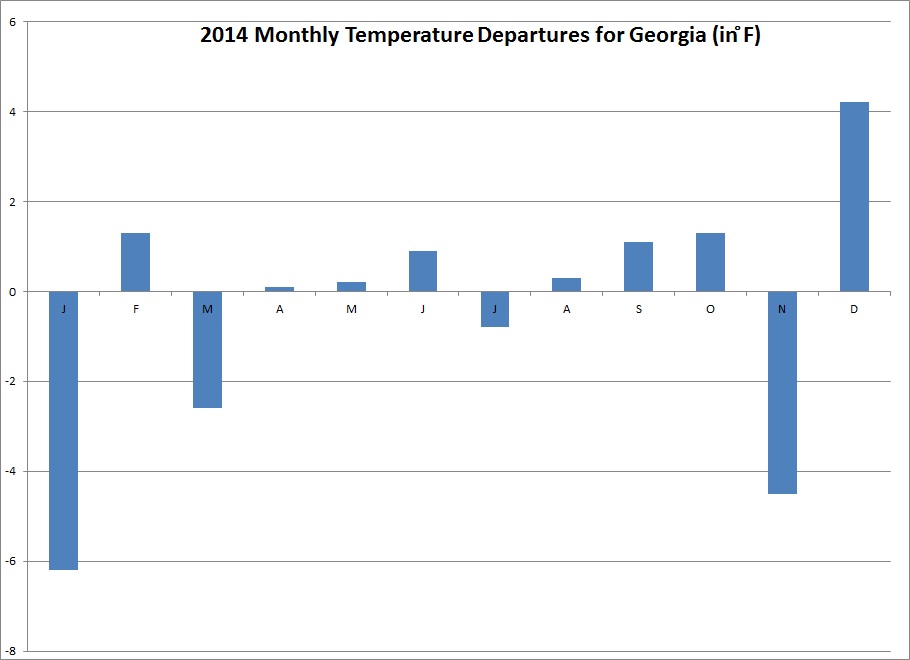
Figure 1. Monthly temperature departures from the 1901-2000 base period (Data source: National Climatic Data Center)
The near-normal conditions in the middle part of the year are even more apparent when you look at the climographs for the state. Figure 2 shows the graph from Macon in central Georgia. Note that the first and last quarters of 2014 were highly variable, with large swings in temperature from hot to cold conditions, while the months in the middle of the year show that temperatures were remarkably close to normal for most of the growing season, with the exception of two unusually cold periods in middle and late July which made it feel more like October.
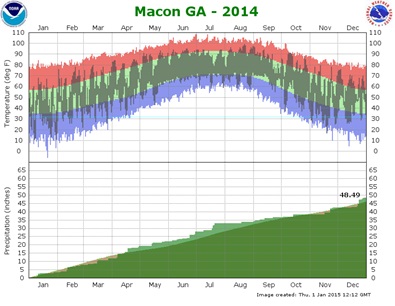
Figure 2. Climograph for Macon GA for 2014 (Source: National Weather Service https://www.srh.noaa.gov/ffc/?n=climateplot_14). Gray lines represent actual observations, while green represents normal temperatures and red and blue represent daily temperature extremes for each date.
The swings in winter and fall temperatures are related to the high-amplitude weather pattern which has dominated the US and the world for much of 2014. In this pattern, a ridge of high pressure developed in the western US and a corresponding trough of low pressure dug into the eastern US. This pattern contributed to the continuation of drought in California and significantly above normal temperatures in the west and Alaska, and helped keep the eastern US relatively cool by comparison.
Figure 3 shows the monthly departures from average for precipitation for Georgia as a whole. The graph shows that most months in the first 2/3 of the year were drier than average, with the exception of a very wet April. The summer dryness can be attributed at least in part to the lack of tropical storms moving through the state this year. The tropical season was fairly quiet across the Atlantic Ocean basin, although it was very wet in the Eastern Pacific Ocean, which is consistent with near-El Nino conditions that lingered through the summer and fall months. Even with the lack of tropical systems, however, fall was wetter than normal. This helped eliminate the dry conditions that occurred across much of Georgia during the growing season due to limited rainfall in June through August. Figure 4 shows the Georgia drought map on September 2, 2014, when the dry conditions were at their maximum extent.

Figure 3. Monthly precipitation departures from the 1901-2000 base period (Data source: National Climatic Data Center)
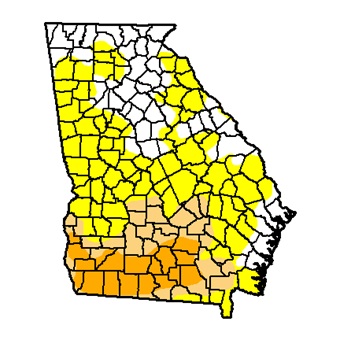
Figure 4. Drought conditions on September 2, 2014 at the maximum extent of severe drought. Over 25% of the state was in drought (tan) and 11% was in severe drought (brown). (Source: National Drought Monitor)
Historically, 2014 was one of the colder years in recent decades (Figure 5). In fact, the eastern United States was one of the few areas on the globe with relatively cool temperatures this year. These cooler temperatures were one of the factors that prevented the dry conditions from turning into a bad drought for the state. The only extended time period in Georgia’s history with no significant droughts was the period from about 1958 to 1980, when cool temperatures and some wet years resulted in a “benign period” during which there were no significant dry spells in the Southeast.
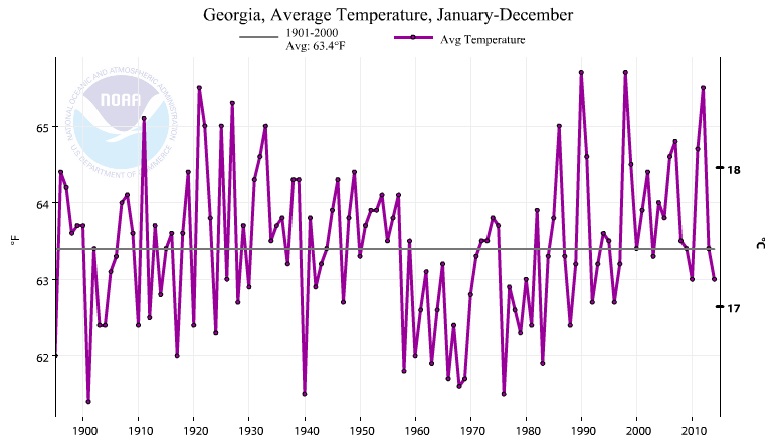
Figure 5. Annual average temperature for Georgia (Source: National Climatic Data Center)
The annual precipitation for the state as a whole was very close to the long-term average from 1901 to 2000 (Figure 6). However, there was quite a bit of variation across Georgia during the year. Figure 7 shows the radar-estimated rainfall for 2014. In general the driest areas were in the northeast mountains and in central Georgia, while the wettest areas were in the Southeast and along the Florida border. However, the heaviest rains in that region fell mainly in April, November and December, not during the height of the growing season.
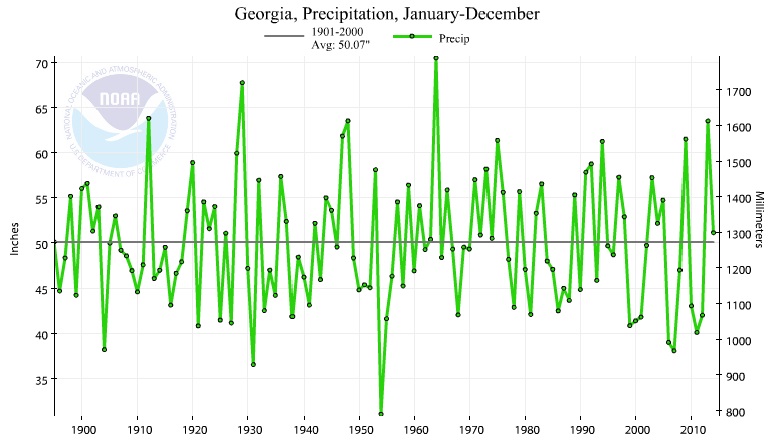
Figure 6. Annual total precipitation for Georgia (Source: National Climatic Data Center)
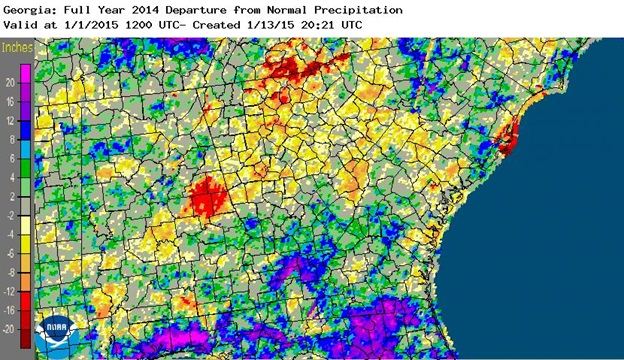
Figure 7. Radar-estimated precipitation departure from normal for 2014 (Source: National Weather Service)
The variable rainfall conditions in 2014 caused problems for farmers in several ways. The wet conditions in spring, particularly in April, delayed necessary field work and planting in some areas. Dry conditions during the growing season caused lack of germination of some seeds and stress on many crops, leading to an increase in irrigation in some areas. The wet fall caused problems for harvest and reduced the yield and quality of some crops as well as making it difficult to get into the fields to harvest.
Although El Niño was expected for much of the year, it never quite officially materialized, although many signs pointed to its presence, including the inactive Atlantic hurricane season and very active Eastern Pacific season. At the end of 2014, warmer than normal ocean temperatures in the Eastern Pacific Ocean were not quite enough to officially declare an El Niño, and it is expected to be less of a concern going into 2015. Early predictions for next year indicate that the opposite pattern, La Niña, might develop by late in the year. Statistically, La Niña years generally have active tropical seasons and dry, warm winters. This could lead to a wetter than expected late summer and fall if the tropics bring storms across Georgia, and less winter recharge of soil moisture going into 2016.